Obstet Gynecol Sci Search

CLOSE


Obstet Gynecol Sci > Volume 66(4); 2023 > Article
Kwon, Heo, and Chun: Triglyceride and glucose index for identifying abnormal insulin sensitivity in women with polycystic ovary syndrome

Abstract

Objective

We aimed to evaluate whether triglyceride and glucose (TyG) indices are useful in identifying insulin sensitivity/resistance in women with polycystic ovary syndrome (PCOS).

Methods

One hundred and seventy-two Korean women aged 18-35 years who were diagnosed with PCOS were included in this study. Fasting-state insulin sensitivity assessment indices (ISAIs) derived from a combination of fasting insulin and glucose levels were calculated for all study participants, and abnormal insulin sensitivity was defined as any of the evaluated ISAIs being out of the established normal range. Correlation analysis was conducted to assess the relationship between the TyG index and other clinical and biochemical parameters. Receiver operating characteristic (ROC) curve analysis was used to determine the optimal cutoff value of the TyG index for identifying abnormal insulin sensitivity, and unpaired t-tests were used to compare biochemical parameters between individuals with a TyG index below the cutoff and individuals with a TyG index above the cutoff value.

Results

All clinical parameters, except age and other insulin resistance-related biochemical parameters, were significantly related to the TyG index. The ROC curve analysis revealed an optimal TyG cutoff value of 8.126 (sensitivity, 0.807; specificity, 0.683) for identifying abnormal insulin sensitivity. In the comparative analysis, all ISAIs and parameters derived from the lipid profiles differed significantly between the TyG groups.

Conclusion

The TyG index is a feasible surrogate marker for predicting insulin sensitivity/resistance in women with PCOS.

Introduction

Polycystic ovary syndrome (PCOS) is characterized not only by anovulation and hyperandrogenism but also by its high association with chronic diseases such as metabolic syndrome, type 2 diabetes (T2DM), and cardiovascular disease [1,2]. Insulin resistance and the resulting hyperinsulinemia are the most important pathophysiological factors that explain the various phenotypic features of PCOS [1-7]. Although it is important to evaluate insulin resistance in women diagnosed with PCOS, there has been no consensus on the optimal method for assessing insulin resistance to date [8].
Insulin sensitivity is the opposite of insulin resistance. A decrease in insulin sensitivity indicates an increase in insulin resistance [8]. Therefore, evaluating insulin sensitivity may be another option for diagnosing insulin resistance. To date, the hyperinsulinemic-euglycemic clamp is regarded as the gold standard for assessing insulin sensitivity/resistance [1,8]. However, owing to various limitations such as cost, time-consuming nature, intensive labor, and the need for an experienced operator to manage technical difficulties, this method can only be used for research purposes and is practically impossible to apply in clinical settings [8]. Therefore, in general observational or epidemiological studies, fasting insulin levels and various insulin sensitivity assessment indices (ISAIs) derived from glucose and fasting insulin concentrations, including the glucose-to-insulin ratio (GIR), homeostatic model assessment of insulin resistance (HOMA-IR), and quantitative insulin sensitivity check index (QUICKI), have been used as indicators to evaluate insulin sensitivity/resistance [1,5,8,9]. However, blood insulin testing is not a commonly performed test due to its high cost and the lack of availability in some undeveloped countries [10]. To date, none of the global clinical guidelines for women with PCOS have mentioned that blood insulin measurement is essential in patients with PCOS, although they have mentioned the need for a blood glucose test, hemoglobin A1C test, or even an oral glucose tolerance test (OGTT) to evaluate blood glycemic status in patients with PCOS [11,12]. Specifically, glucose tolerance and insulin sensitivity are not equivalent, indicating that the OGTT cannot entirely replace blood insulin testing. Therefore, there is a need for an assessment tool to evaluate insulin resistance that can replace blood insulin testing in women with PCOS.
Dyslipidemia, defined as an increase in total cholesterol (TC) and low-density lipoprotein cholesterol (LDL-C), an increase in triglycerides (TG), and a decrease in high-density lipoprotein cholesterol (HDL-C), is a common clinical feature in women with insulin resistance [1,3,5,10]. In particular, low HDL-C and high TG levels are critical features included in the diagnostic criteria for metabolic syndrome, also known as insulin resistance syndrome [13]. Various parameters based on blood lipid profile levels (especially TG levels), such as the TG/HDL-C ratio, have been known to be useful markers for predicting insulin resistance [10,14,15].
Recently, the triglyceride and glucose (TyG) index has been recommended as a very useful index that can replace insulin testing in evaluating insulin resistance because various studies have demonstrated the usefulness of this index for evaluating insulin resistance [10,14-21]. Although several studies have identified other TG-based markers as indicators for assessing insulin resistance in women with PCOS [15,22-25], studies on the feasibility of the TyG index for predicting insulin resistance in women with PCOS are still lacking.
In this study, we aimed to evaluate whether the TyG index is a useful surrogate marker for identifying insulin sensitivity/resistance in women with PCOS.

Materials and methods

1. Participants

Korean women aged 18-35 who were newly diagnosed with PCOS between January 2010 and December 2013 were recruited. Among all patients diagnosed with PCOS based on the 2003 Rotterdam criteria, those who met the recently revised diagnostic criteria in the International consensus guidelines for PCOS were enrolled in this study [12,26]. The exclusion criteria were as follows: patients who were previously diagnosed with diabetes, thyroid disease, or hyperprolactinemia; those with a history of ovarian surgery; medication use known to affect sex hormones or gonadotropin levels within 6 months of enrollment in the study (e.g., oral contraceptives, ovulation induction agents, glucocorticoids, or antiandrogens); and those taking antidiabetic drugs, including insulin sensitizers [27-31]. This retrospective study was approved by the Institutional Review Board of the Inje University Haeundae Paik Hospital (IRB No. 129792-2014-035), which waived the requirement for informed patient consent in the present study. Finally, 172 PCOS patients were enrolled in this study.

2. Measurement of anthropometric parameters and ultrasound examinations

Clinical variables were evaluated in all study patients when they first visited the outpatient department. Pelvic ultrasound examinations (transvaginal or transrectal) were conducted in the early follicular phase using Voluson LOGIQ S7 (GE Ultrasound Korea, Ltd., Seongnam, Korea) equipped with a microconvex intracavitary probe with a frequency range of 3.6-9.0 MHz. Polycystic ovaries was defined as the presence of >20 follicles (2-9 mm in size) and/or an ovarian volume >10 mL [12,26]. All ultrasound examinations were performed by the same ultrasound expert in reproductive endocrinology based on the international consensus on ultrasound assessment of PCOS [32].

3. Biochemical measurements and determination of abnormal glucose tolerance

Blood samples for biochemical analyses were obtained from all subjects in the early follicular phase after overnight fasting, according to the guidelines of the Declaration of Helsinki. Serum glucose and insulin levels were analyzed using an L-Type GluI device (Wako, Osaka, Japan) and Elecsys Insulin assay (Roche), respectively. TC and TG levels were measured using Pureauto S (Sekisui, Tokyo, Japan) and serum HDL-C and LDL-C levels were measured using Cholestest (Sekisui). Both the intra- and inter-assay coefficients of variation for all tests were <5%.
Established fasting ISAIs derived from a combination of fasting insulin and glucose levels were calculated in all study participants as follows [27-31]: HOMA-IR was calculated as glucose value (mg/dL)×insulin value (μU/mL)/405; GIR was calculated by dividing the glucose value (mg/dL) by the insulin value (μU/mL); and QUICKI was calculated as 1/(log [insulin value (μU/mL)]+log [glucose value (mg/dL)]). Patients with PCOS showing abnormal levels for at least one of the established ISAI criteria in previous studies conducted on Asian women were defined as having abnormal insulin sensitivity: fasting insulin ≥15 μU/mL [33], HOMA-IR ≥2.64 [9], GIR ≤10.7 or QUICKI ≤0.34 [34].
The TG/HDL-C ratio was calculated by dividing the triglyceride level (mg/dL) by the HDL-C level (mg/dL). The TyG index was determined using the following formula: ln (fasting triglyceride [mg/dL]×fasting glucose level [mg/dL]/2) [10-19].

4. Statistical analyses

Values are expressed as the mean±standard deviation. Correlation analysis was conducted to assess the association between the TyG index and other clinical and biochemical parameters using Spearman’s rank correlation coefficients and linear regression analysis, with partial correlations used to control for the effects of other confounding anthropometric factors. Data from all study participants were used to identify the optimal cutoff value of the TyG index for identifying abnormal insulin sensitivity based on receiver operating characteristic (ROC) curve analysis, and the optimal cutoff value of the TyG index for identifying abnormal insulin sensitivity was defined as the threshold value at which the sum of sensitivity and specificity was maximized. Unpaired t-tests were used to compare the clinical and biochemical parameters between the two groups categorized according to the TyG index cutoff value. All statistical analyses were conducted using IBM SPSS Statistics (version 25.0; IBM Corp., Armonk, NY, USA), with P<0.05 considered statistically significant.

Results

Table 1 shows the baseline clinical and laboratory biochemical parameters of study participants.
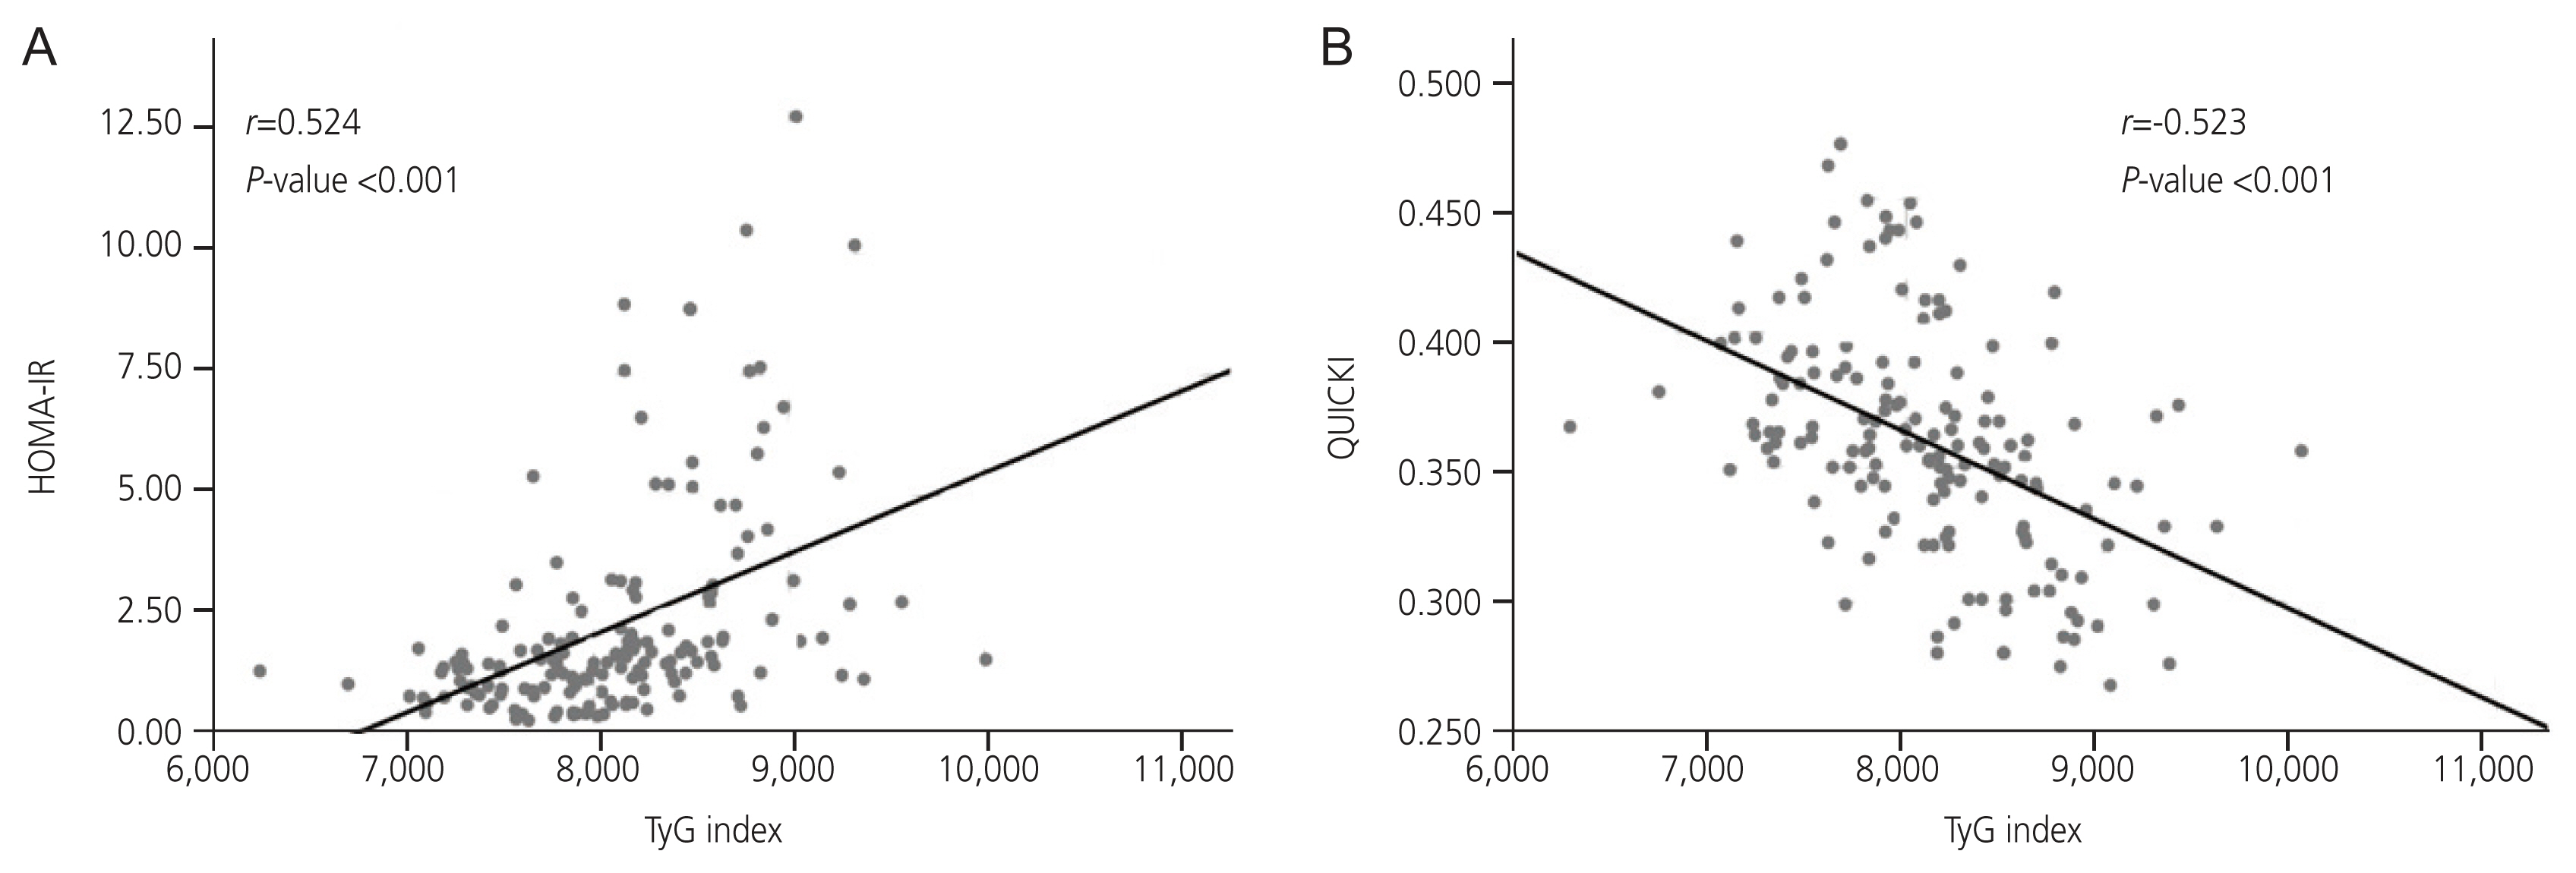
In the correlation analysis, all clinical parameters except age and all insulin resistance-related biochemical parameters were significantly associated with the TyG index P-values of less than 0.01 (Table 2). In particular, strong associations of the TyG index with HOMA-IR (r=0.524) and QUICKI (r=−0.523) were found, as shown in Fig. 1. These results did not change after adjusting for other anthropometric covariates, such as body mass index (BMI) and waist-hip ratio (WHR), although the strength of the existing correlations was somewhat reduced after adjusting for these covariates (Table 3).
ROC curve analysis revealed an optimal TyG cutoff of 8.126 (sensitivity, 0.807; specificity, 0.683) for identifying abnormal insulin sensitivity (Fig. 2).
All patients were divided into two groups according to the TyG index cutoff values: group 1 (TyG index <8.126) and group 2 (TyG index >8.126) (Table 4). Comparative analysis using unpaired t-tests showed that all ISAIs and parameters derived from lipid profiles were significantly different between the two groups.

Discussion

Insulin resistance plays a central role in the pathophysiology and development of long-term complications in patients with PCOS. Insulin sensitivity is the opposite of insulin resistance. In addition to the dynamic euglycemic clamp method, which is considered the gold standard method for evaluating insulin sensitivity, various ISAIs derived from fasting insulin levels have been used to evaluate the status of insulin sensitivity/resistance in women with PCOS [1,8,10]. However, insulin testing is expensive and complicated, is not available in some undeveloped countries, and these methods are not regarded as essential diagnostic and screening tools for women with PCOS [11,12,26]. Furthermore, the American Diabetes Association recommends against screening for insulin resistance in both the general population and high-risk populations [35]; instead, criteria have been developed for defining metabolic syndrome, a diagnostic term that includes components closely related to insulin resistance such as centripetal obesity, hypertension, fasting hyperglycemia, and dyslipidemia [13,26,35,36]. Therefore, there is an increasing demand for another method to replace the fasting insulin test for evaluating insulin resistance in women with PCOS. The purpose of the present study was to evaluate the feasibility of the TyG index as a surrogate marker for identifying insulin sensitivity/resistance in women with PCOS and to show that the TyG index is a reliable surrogate marker for identifying abnormal insulin sensitivity in patients with PCOS. In the present study, all ISAIs were significantly correlated with the TyG index, and these significant correlations did not change even after adjusting for BMI and WHR.
Dyslipidemia, particularly decreased blood HDL-C and increased blood TG levels, is a common and typical feature in women with insulin resistance and is included in the diagnostic criteria for insulin resistance syndrome (i.e., metabolic syndrome) [13]. Various studies have demonstrated that parameters based on lipid profile levels, such as TG and HDL levels, and various ratio parameters derived from lipid profiles, such as TG/HDL-C and LDL-C/HDL-C levels, are good surrogate markers for predicting insulin resistance [10,15,18,22-25,37]. Some studies have reported that these lipid profile markers are useful for predicting insulin resistance in women with PCOS [15,22-24,37].
Recently, the TyG index has been highlighted as a promising surrogate marker to replace the blood insulin test for evaluating insulin resistance. When compared to traditional lipid ratio parameters, such as TC/HDL-C, HDL-C/HDL-C, LDL-C/HDL-C, and TG/HDL-C levels, the TyG index was shown to have a stronger association with HOMA-IR [21]. Guerrero-Romero et al. [20] compared the TyG index with the hyperinsulinemic-euglycemic clamp test, and the results showed that the Pearson correlation coefficient between the TyG index and the total glucose metabolism rate using the dynamic euglycemic clamp method was −0.681, suggesting that the TyG index could be useful for the identification of subjects with decreased insulin sensitivity. According to a systematic review using the hyperinsulinemic-euglycemic clamp method and HOMA-IR as reference tests, the TyG index showed the highest achieved sensitivity of 96% and the highest specificity of 99% [18]. The TyG index has been demonstrated to be associated with the risk of T2DM and metabolic syndrome [16,38].
Although several studies have demonstrated the feasibility of the TyG index for predicting insulin resistance, only a few have examined its predictive capability of the TyG index for insulin resistance in women with PCOS [36,38,39]. According to Zheng et al. [39], the TyG index was significantly correlated with HOMA-IR (r=0.515; P<0.01) and QUICKI (r=−0.532) in Chinese women with PCOS. ROC analysis for predicting insulin resistance defined by HOMA-IR showed that the area under the receiver operating characteristic curve value of TyG for insulin resistance was 0.781, and the optimal cutoff value of the TyG index for insulin resistance in women with PCOS was 8.51 (sensitivity, 63.2%; specificity, 87.0%). These results were consistent with our findings. Another study also showed a strong positive correlation between HOMA-IR and TyG index (r=0.776) in women with PCOS [40]. Kheirollahi et al. [37] conducted a study on the correlation between TG/HDL-C, TC/HDL-C, the TyG index, and insulin resistance in 305 Iranian women with PCOS and reported that the TyG index was strongly correlated with ISAIs such as HOMA-IR, QUICKI, and GIR, which was also consistent with our results.
In the present study, the calculated cutoff value of the TyG index for abnormal insulin sensitivity was 8.126 in women with PCOS, which was similar to the cutoff value 8.51 for insulin resistance in Zheng et al. [39]. The differences in study participants, study design, and the definition of insulin resistance may be the reasons for reporting different TyG index cutoff values in different studies. In addition, some authors have used different formulas of ln ([fasting TG leve]×[fasting glucose level])/2 (which is the same as the formula used in TyG calculators that are easily available online) in their studies [41], and this seems to be another reason for the different threshold values of the TyG index for insulin resistance in different studies.
The present study has some limitations. Since our study was a retrospective observational study, it was inevitable that we could not use the glucose clamp technique, such as the hyperinsulinemic-euglycemic clamp, as a reference test, which is the gold standard for evaluating insulin sensitivity but is practically impossible to apply in clinical settings [8]. Nevertheless, it would have been better to include postprandial ISAIs and other parameters, such as the Matsuda index derived from postprandial glucose and insulin levels, to assess insulin sensitivity/resistance in our study. In addition, although the total number of participants in our study (n=172) did not seem to be relatively small compared to those in other studies [39,40], the sample size was not large enough to conduct a subgroup analysis according to the different phenotypes of PCOS, which could be another drawback of our study. However, one advantage of our study was that abnormal insulin sensitivity was evaluated together with the four ISAIs rather than with only a single ISAI, such as HOMA-IR.
In conclusion, the TyG index was significantly associated with several ISAIs and showed strong predictive capability for identifying abnormal insulin sensitivity in women with PCOS. As both blood TG and glucose tests are inexpensive and routinely performed in patients with PCOS, the TyG index can be used as a promising surrogate marker for predicting insulin resistance in women with PCOS. Further large-scale prospective studies are needed to confirm these results.

Notes

Conflict of interest

The authors declare no conflict of interests for this article.

Ethical approval

This retrospective study was approved by the lnstitutional Review Board of the Inje University Haeundae Paik Hospital (IRB No. 129792-2014-035).

Patient consent

The requirement for informed consent in the present study was waived due to the retrospective study and full anonymity of the participants was maintained.

Funding information

None.

Fig. 1
Correlations between triglyceride and glucose index and insulin sensitivity assessment indices in women with polycystic ovary syndrome. (A) HOMA-IR. (B) QUICKI. HOMA-IR, homeostasis model assessment of insulin resistance; TyG index, triglyceride and glucose index; QUICKI, quantitative insulin sensitivity check index.
ogs-23103f1.jpg
Fig. 2
Receiver operating characteristic curve analysis to assess the predictive capability of triglyceride and glucose index for abnormal insulin sensitivity/resistance in women with polycystic ovary syndrome. AUC, area under the receiver operating characteristic curve.
ogs-23103f2.jpg
Table 1
Baseline clinical and laboratory characteristics of study participants
Characteristic Participants (n=172)
Age (yr) 25.98±5.15
Parity 0.15±0.47
Height (cm) 161.89±5.56
Body weight (kg) 58.73±14.78
Body mass index (kg/m2) 22.36±5.29
Waist to hip ratio 0.79±0.07
Cholesterol (mg/dL) 177.27±30.99
Triglyceride (mg/dL) 92.40±73.15
HDL-C (mg/dL) 59.81±15.76
LDL-C (mg/dL) 101.40±28.35
TyG index 8.12±0.61
TG-HDL ratio 1.82±2.18
Fasting glucose (mg/dL) 90.33±6.94
Fasting insulin (μU/mL) 9.98±9.20
HOMA-IR (fasting) 2.28±2.21
GIR (fasting) 15.41±10.40
QUICKI (fasting) 0.36±0.04

Values are presented as mean±standard deviation.

HDL-C, high-density lipoprotein cholesterol; LDL-C, low-density lipoprotein cholesterol; TyG index, triglyceride and glucose index; TG-HDL, triglyceride to high-density lipoprotein cholesterol; HOMA-IR, homeostasis model assessment of insulin resistance; GIR, glucose to insulin ratio; QUICKI, quantitative insulin sensitivity check index.

Table 2
Correlations between triglyceride and glucose index and insulin resistance-related clinical and biochemical parameters in women with polycystic ovary syndrome
TyG index
r P
Age 0.138 0.074
Body mass index 0.471 <0.001a)
Waist-to-hip ratio 0.442 <0.001a)
Cholesterol (mg/dL) 0.347 <0.001a)
Triglyceride (mg/dL) 0.991 <0.001a)
HDL-C (mg/dL) −0.405 <0.001a)
LDL-C (mg/dL) 0.384 <0.001a)
TG-HDL ratio 0.936 <0.001a)
Fasting glucose (mg/dL) 0.349 <0.001a)
Fasting insulin (μU/mL) 0.516 <0.001a)
HOMA-IR (fasting) 0.524 <0.001a)
GIR (fasting) −0.501 <0.001a)
QUICKI (fasting) −0.523 <0.001a)

r=Spearman rank correlation coefficient.

TyG index, triglyceride and glucose index; HDL-C, high-density lipoprotein cholesterol; LDL-C, low-density lipoprotein cholesterol; TG-HDL, triglyceride to high-density lipoprotein cholesterol; HOMA-IR, homeostasis model assessment of insulin resistance; GIR, glucose to insulin ratio; QUICKI, quantitative insulin sensitivity check index.

a) P<0.05.

Table 3
Correlations between triglyceride and glucose index and insulin resistance-related biochemical parameters after adjustment for confounding factors in women with polycystic ovary syndrome
TyG index
ra) P-value rb) P-value
Cholesterol (mg/dL) 0.347 <0.001c) 0.278 0.001c)
Triglyceride (mg/dL) 0.854 <0.001c) 0.866 <0.001c)
HDL-C (mg/dL) −0.292 <0.001c) −0.319 <0.001c)
LDL-C (mg/dL) 0.279 <0.001c) 0.251 0.003c)
TG-HDL ratio 0.730 <0.001c) 0.706 <0.001c)
Fasting glucose (mg/dL) 0.250 0.001c) 0.260 0.002c)
Fasting insulin (μU/mL) 0.316 <0.001c) 0.330 <0.001c)
HOMA-IR (fasting) 0.315 <0.001c) 0.328 <0.001c)
GIR (fasting) −0.238 0.003c) −0.273 0.001c)
QUICKI (fasting) −0.348 <0.001c) −0.371 <0.001c)

TyG index, triglyceride and glucose index; HDL-C, high-density lipoprotein cholesterol; LDL-C, low-density lipoprotein cholesterol; TG-HDL, triglyceride to high-density lipoprotein cholesterol; HOMA-IR, homeostasis model assessment of insulin resistance; GIR, glucose to insulin ratio; QUICKI, quantitative insulin sensitivity check index.

a) r=Partial correlation coefficient adjusted by body mass index.

b) r=Partial correlation coefficient adjusted by waist-to-hip ratio.

c) P<0.05.

Table 4
Comparison of fasting state insulin resistance-related metabolic parameters between the two groups divided according to the cutoff value of triglyceride and glucose index in women with polycystic ovary syndrome
Group 1 (n=85) Group 2 (n=87) P-value
TyG index 7.65±0.34 8.59±0.43 <0.001a)
TG-HDL ratio 0.80±0.30 2.70±2.50 <0.001a)
Cholesterol (mg/dL) 169.95±27.52 184.24±33.07 0.003a)
Triglyceride (mg/dL) 49.94±14.41 130.39±80.61 <0.001a)
HDL-C (mg/dL) 65.77±15.68 54.44±13.71 <0.001a)
LDL-C (mg/dL) 93.00±25.68 109.26±29.12 <0.001a)
Fasting glucose (mg/dL) 88.39±7.12 92.19±6.30 <0.001a)
Fasting insulin (μU/mL) 5.79±3.22 14.27±11.18 <0.001a)
HOMA-IR (fasting) 1.29±0.82 3.30±2.69 <0.001a)
GIR (fasting) 19.85±10.66 10.86±7.91 <0.001a)
QUICKI (fasting) 0.38±0.04 0.34±0.04 <0.001a)

Values are presented as mean±standard deviation.

P-value was obtained using an unpaired t-test.

TyG index, triglyceride and glucose index; TG-HDL, triglyceride to high-density lipoprotein cholesterol; HDL-C, high-density lipoprotein cholesterol; LDL-C, low-density lipoprotein cholesterol; HOMA-IR, homeostasis model assessment of insulin resistance; GIR, glucose to insulin ratio; QUICKI, quantitative insulin sensitivity check index.

a) P<0.05.

References

1. Peterson KR, Link M, Peterson CM. Endocrine disorder. In: Berek JS, editors. Berek & Novak’s gynecology. 16th ed.Philadelphia: Lippincott Williams & Wilkins; 2019. p. 889-941.

2. McCartney CR, Marshall JC. Clinical practice: polycystic ovary syndrome. N Engl J Med 2016;375:54-64.
crossref pmid pmc
3. Ehrmann DA. Polycystic ovary syndrome. N Engl J Med 2005;352:1223-36.
crossref pmid
4. Carmina E, Lobo RA. Use of fasting blood to assess the prevalence of insulin resistance in women with polycystic ovary syndrome. Fertil Steril 2004;82:661-5.
crossref pmid
5. Sam S, Dunaif A. Polycystic ovary syndrome: syndrome XX? Trends Endocrinol Metab 2003;14:365-70.
crossref pmid
6. Chun S. Predictive capability of fasting-state glucose and insulin measurements for abnormal glucose tolerance in women with polycystic ovary syndrome. Clin Exp Reprod Med 2021;48:156-62.
crossref pmid pmc pdf
7. Dunaif A. Insulin resistance and the polycystic ovary syndrome: mechanism and implications for pathogenesis. Endocr Rev 1997;18:774-800.
crossref pmid
8. Muniyappa R, Lee S, Chen H, Quon MJ. Current approaches for assessing insulin sensitivity and resistance in vivo: advantages, limitations, and appropriate usage. Am J Physiol Endocrinol Metab 2008;294:E15-26.
crossref pmid
9. Kim JJ, Hwang KR, Oh SH, Chae SJ, Yoon SH, Choi YM. Prevalence of insulin resistance in Korean women with polycystic ovary syndrome according to various homeostasis model assessment for insulin resistance cutoff values. Fertil Steril 2019;112:959-66.
crossref pmid
10. Son DH, Ha HS, Park HM, Kim HY, Lee YJ. New markers in metabolic syndrome. Adv Clin Chem 2022;110:37-71.
crossref pmid
11. Legro RS, Arslanian SA, Ehrmann DA, Hoeger KM, Murad MH, Pasquali R, et al. Diagnosis and treatment of polycystic ovary syndrome: an endocrine society clinical practice guideline. J Clin Endocrinol Metab 2013;98:4565-92.
crossref pmid pmc
12. Teede HJ, Misso ML, Costello MF, Dokras A, Laven J, Moran L, et al. Recommendations from the international evidence-based guideline for the assessment and management of polycystic ovary syndrome. Hum Reprod 2019;34:388.
crossref pmid pdf
13. Alberti KG, Zimmet P, Shaw J. Metabolic syndrome--a new world-wide definition. A consensus statement from the international diabetes federation. Diabet Med 2006;23:469-80.
crossref pmid
14. Krawczyk M, Rumińska M, Witkowska-Sędek E, Majcher A, Pyrżak B. Usefulness of the triglycerides to high-density lipoprotein cholesterol ratio (TG/HDL-C) in prediction of metabolic syndrome in Polish obese children and adolescents. Acta Biochim Pol 2018;65:605-11.
crossref pmid pdf
15. Blum MR, Popat RA, Nagy A, Cataldo NA, McLaughlin TL. Using metabolic markers to identify insulin resistance in premenopausal women with and without polycystic ovary syndrome. J Endocrinol Invest 2021;44:2123-30.
crossref pmid pdf
16. Navarro-González D, Sánchez-Íñigo L, Pastrana-Delgado J, Fernández-Montero A, Martinez JA. Triglyceride-glucose index (TyG index) in comparison with fasting plasma glucose improved diabetes prediction in patients with normal fasting glucose: the vascular-metabolic CUN cohort. Prev Med 2016;86:99-105.
crossref pmid
17. Moon S, Park JS, Ahn Y. The cut-off values of triglycerides and glucose index for metabolic syndrome in American and Korean adolescents. J Korean Med Sci 2017;32:427-33.
crossref pmid pdf
18. Sánchez-García A, Rodríguez-Gutiérrez R, Mancillas-Adame L, González-Nava V, Díaz González-Colmenero A, Solis RC, et al. Diagnostic accuracy of the triglyceride and glucose index for insulin resistance: a systematic review. Int J Endocrinol 2020 2020:4678526.

19. Simental-Mendía LE, Rodríguez-Morán M, Guerrero-Romero F. The product of fasting glucose and triglycerides as surrogate for identifying insulin resistance in apparently healthy subjects. Metab Syndr Relat Disord 2008;6:299-304.
crossref pmid
20. Guerrero-Romero F, Simental-Mendía LE, González-Ortiz M, Martínez-Abundis E, Ramos-Zavala MG, Hernández-González SO, et al. The product of triglycerides and glucose, a simple measure of insulin sensitivity. Comparison with the euglycemic-hyperinsulinemic clamp. J Clin Endocrinol Metab 2010;95:3347-51.
crossref pmid
21. Du T, Yuan G, Zhang M, Zhou X, Sun X, Yu X. Clinical usefulness of lipid ratios, visceral adiposity indicators, and the triglycerides and glucose index as risk markers of insulin resistance. Cardiovasc Diabetol 2014;13:146.
crossref pmid pmc pdf
22. Song do K, Lee H, Sung YA, Oh JY. Triglycerides to high-density lipoprotein cholesterol ratio can predict impaired glucose tolerance in young women with polycystic ovary syndrome. Yonsei Med J 2016;57:1404-11.
crossref pmid pmc pdf
23. Ghaffarzad A, Amani R, Mehrzad Sadaghiani M, Darabi M, Cheraghian B. Correlation of serum lipoprotein ratios with insulin resistance in infertile women with polycystic ovarian syndrome: a case control study. Int J Fertil Steril 2016;10:29-35.
pmid pmc
24. Xiang SK, Hua F, Tang Y, Jiang XH, Zhuang Q, Qian FJ. Relationship between serum lipoprotein ratios and insulin resistance in polycystic ovary syndrome. Int J Endocrinol 2012 2012:173281.
crossref pdf
25. Ulutaş F, Cander S, Özen ÖZ. The association between triglycerides/high-density lipoprotein cholesterol ratio, insulin resistance, and serum androgen levels in patients with polycystic ovary syndrome. Eur Res J 2022;8:275-81.
crossref
26. Rotterdam ESHRE/ASRM-Sponsored PCOS consensus workshop group. Revised 2003 consensus on diagnostic criteria and long-term health risks related to polycystic ovary syndrome (PCOS). Hum Reprod 2004;19:41-7.
crossref pmid
27. Chun S. 1-h postprandial glucose level is related to the serum anti-müllerian hormone level in women with polycystic ovary syndrome. Gynecol Endocrinol 2015;31:815-8.
crossref pmid
28. Park CH, Chun S. Association between serum gonadotropin level and insulin resistance-related parameters in Korean women with polycystic ovary syndrome. Obstet Gynecol Sci 2016;59:498-505.
crossref pmid pmc pdf
29. Park CH, Chun S. Influence of combined oral contraceptives on polycystic ovarian morphology-related parameters in Korean women with polycystic ovary syndrome. Obstet Gynecol Sci 2020;63:80-6.
crossref pmid pdf
30. Kim N, Chun S. Association between the serum estrone-to-estradiol ratio and parameters related to glucose metabolism and insulin resistance in women with polycystic ovary syndrome. Clin Exp Reprod Med 2021;48:374-9.
crossref pmid pmc pdf
31. Chun S, Lee S. Optimal cutoff value of 1-hour postload glucose to identify insulin resistance in women with polycystic ovary syndrome. Clin Exp Obstet Gynecol 2022;49:219.
crossref
32. Balen AH, Laven JS, Tan SL, Dewailly D. Ultrasound assessment of the polycystic ovary: international consensus definitions. Hum Reprod Update 2003;9:505-14.
crossref pmid
33. Negishi H, Nakao K, Kimura M, Takenaka H, Horikawa M. Insulin resistance in nonobese Japanese women with polycystic ovary syndrome is associated with poorer glucose tolerance, delayed insulin secretion, and enhanced insulin response. Reprod Med Biol 2015;14:123-9.
crossref pmid pmc pdf
34. Chen X, Yang D, Li L, Feng S, Wang L. Abnormal glucose tolerance in Chinese women with polycystic ovary syndrome. Hum Reprod 2006;21:2027-32.
crossref pmid
35. Consensus development conference on insulin resistance. 5-6 November 1997. American Diabetes Association. Diabetes Care 1998;21:310-4.
crossref pmid pdf
36. Expert Panel on Detection, Evaluation, and Treatment of High Blood Cholesterol in Adults. Executive summary of the third report of the national cholesterol education program (NCEP) expert panel on detection, evaluation, and treatment of high blood cholesterol in adults (Adult Treatment Panel III). JAMA 2001;285:2486-97.
crossref pmid
37. Kheirollahi A, Teimouri M, Karimi M, Vatannejad A, Moradi N, Borumandnia N, et al. Evaluation of lipid ratios and triglyceride-glucose index as risk markers of insulin resistance in Iranian polycystic ovary syndrome women. Lipids Health Dis 2020;19:235.
crossref pmid pmc pdf
38. Li R, Li Q, Cui M, Yin Z, Li L, Zhong T, et al. Clinical surrogate markers for predicting metabolic syndrome in middle-aged and elderly Chinese. J Diabetes Investig 2018;9:411-8.
crossref pmid pdf
39. Zheng Y, Yin G, Chen F, Lin L, Chen Y. Evaluation of triglyceride glucose index and homeostasis model of insulin resistance in patients with polycystic ovary syndrome. Int J Womens Health 2022;14:1821-9.
crossref pmid pmc pdf
40. Bilginer MC, Tufekci D, Gunay YE, Usta O, Coskun H, Ucuncu O, et al. Evaluation of insulin resistance measurement methods in patients with polycystic ovary sdyndrome. Turk J Diab Obes 2022;1:24-31.

41. Alizargar J, Hsieh NC, Wu SV. The correct formula to calculate triglyceride-glucose index (TyG). J Pediatr Endocrinol Metab 2020;33:945-6.
crossref pmid


ABOUT
ARTICLE & TOPICS
Article category

Browse all articles >

Topics

Browse all articles >

BROWSE ARTICLES
POLICY
FOR CONTRIBUTORS
Editorial Office
4th Floor, 36 Gangnam-daero 132-gil, Gangnam-gu, Seoul 06044, Korea.
Tel: +82-2-2266-7238    Fax: +82-2-3445-2440    E-mail: journal@ogscience.org                

Copyright © 2024 by Korean Society of Obstetrics and Gynecology.

Developed in M2PI

Close layer
prev next