Endometrial thickness and uterine artery Doppler parameters as soft markers for prediction of endometrial cancer in postmenopausal bleeding women: a cross-sectional study at tertiary referral hospitals from Vietnam
Article information

Abstract
Objective
To determine the value of endometrial thickness (ET) and Doppler indices of uterine artery (UtA) as sonographic markers in predicting endometrial cancer (EC) among postmenopausal bleeding (PMB) women in low-resource settings as Vietnam.
Methods
This cross-sectional study was conducted at the Hue University Hospital and Hue Central Hospital between June 2016 and June 2019. The study enrolled all women who complained of PMB and were followed by transvaginal Doppler ultrasound. Their definitive histopathological examination was the gold standard for comparison.
Results
The UtA Doppler indices, including resistance index (RI), pulsatility index (PI), and peak systolic velocity (PSV), were significantly lower in the malignant group than in the benign group. The threshold values of the UtA, RI ≤0.73 and PI ≤1.42, were found with an area under receiver operating characteristic curve (AUC) of 0.85–0.88, and the sensitivity and specificity were 91.3% and 83.3%, respectively. Unlike PSV, the diagnostic value was the lowest, with an AUC of 0.72. ET was a good predictor for the diagnosis of EC, with an AUC of 0.89. In women with PMB, when using the cutoff value of EC more than 12.5 mm, the sensitivity and specificity were 93.8% and 77.8%, respectively. In addition, the higher the stage of EC, the lower the RI and PI and the greater the EC.
Conclusion
ET, and RI, PI, and PSV of the UtA could help in differentiating malignant from benign endometrial changes. Pulsed ultrasonic Doppler velocimetry seems to play a role in predicting the higher stages of EC. Further studies are needed to confirm these findings.
Introduction
Endometrial cancer (EC) is the sixth most common cancer in women worldwide and the most common malignant gynecological disease in postmenopausal women owing to increasing life expectancy. In 2020, GLOBOCAN estimated 417,000 new cases and 97,000 deaths, and the incidence has increased in many countries [1]. The older the woman with postmenopausal bleeding (PMB), the higher the risk of EC [2]. Fortunately, 95% of EC stage I could be curable by surgery with a 5-year survival rate of 85–91%, and approximately 90% of EC presents with vaginal bleeding. PMB is defined as vaginal bleeding occurring more than 12 months after the cessation of menstruation at menopause [3]. PMB is an early symptom of EC, with up to 10% of PMB related to EC. In general, malignant endometrial pathology is 4-fold more prevalent in women with bleeding than in those without bleeding [4]. Therefore, routine investigation of EC in women with PMB is an important global strategy to reduce the burden of cancer and change the quality of life in postmenopausal women, especially in developing countries with low-resource settings, such as Vietnam [5–7].
Currently, many available modalities for uterine investigation have been applied, including invasive and noninvasive methods. However, invasive procedures and expensive modalities are not suitable for health care center in low-middle countries. Meanwhile, ultrasound has been widely accepted as the first line tool in approaching gynecologic problems because of its reliability and availability. In particular, the Doppler ultrasound can accurately detect vascular flow in a tumor [8]. The low resistance index (RI), pulsatility index (PI), and peak systolic velocity (PSV) of the uterine artery (UtA) are associated with malignancy [9,10]. The combination of Grey scale ultrasound with transvaginal color Doppler ultrasound (TV-CDU) is useful for distinguishing between benign endometrium and endometrial cancer. Moreover, this tool may help in differentiating between low-grade and high-grade tumors as well as evaluating the preoperative tumor invasion before surgery [11]. However, this combination remains controversial among studies [12]. In Vietnam, this controversy is not of great concern; thus, our study aimed to elucidate the optimal value of ultrasonographic findings and Doppler indices in predicting EC.
Materials and methods
This cross-sectional study was conducted according to the ethics committee of our institution and approved by our Institutional Review Board (number 1435/QĐ-ĐHYD). Written informed consent was obtained from all female patients. This study was conducted at the Hue University Hospital and Hue Central Hospital between June 2016 and June 2019.
The inclusion criteria were as follows: PMB (intrauterine bleeding and more than 12 months of amenorrhea naturally), uterine ultrasound B-mode combined with Doppler, and histopathological results for comparison. The exclusion criteria included the following: bleeding related to pregnancy, hormone replacement therapy, tamoxifen, coagulation disorders, bleeding not originating from the uterine cavity, abnormalities associated with the cervix, iatrogenic bleeding, lack of patient information on the study protocol, and missing histopathological endpoints. Overall, 60 women met the inclusion criteria and agreed to participate in this study. All enrolled patients underwent the following: thorough disease history, general examination, gynecological examination, cervical cytology (Pap. smear), and laboratory investigations (complete blood count, liver function tests, kidney function tests, and coagulation tests). Transvaginal sonography was performed for all patients using a 5–7.5 MHz endovaginal transducer of a sonographic machine (Samsung WS80A, HS70A, Yongin, Korea). Four sonographers with more than 5 years of experience were randomly allocated to each patient. All patients underwent interventional procedures, such as endometrial biopsy, hysteroscopy, or hysterectomy, after sonographic investigation. These indications were warranted and followed the medical protocol applied at our hospital.
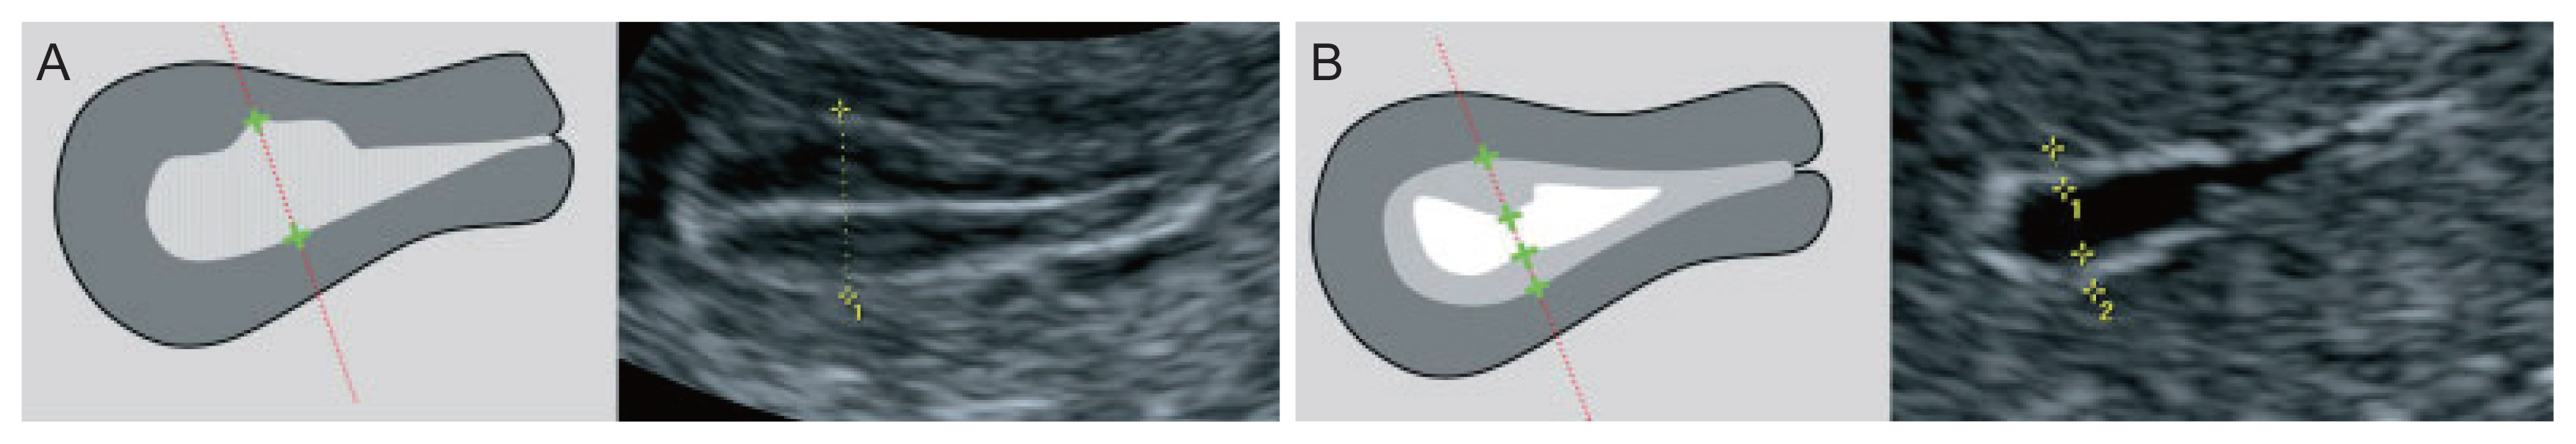
1. Measurement of endometrial thickness
The endometrial thickness (ET) is the largest measurement of the endometrium in the sagittal plane and includes both sides of the endometrium [13]. A continuous endometrial line from the cervical canal to the intrauterine cavity should be observed. The “+” caliper was placed on both sides of the endometrium border at the myometrium-endometrial boundary, the screen was magnified to see the clearest image, and the endometrium was measured at the thickest place perpendicular to the midline of the endometrium (Fig. 1A). The total thickness of the two layers was measured in millimeters (mm) and rounded to the first decimal place. For the case of a cavity filled with fluid, the caliper “+” measured the ET on each side, and then the two measurements were added together to give the ET (Fig. 1B). If the endometrium was asymmetrically thick, the anterior and posterior maximal thicknesses were recorded separately. When the total endometrium could not be clearly observed, the result was concluded as “unmeasurable/undefined” and not measured in this case.
If there was an intracavitary lesion, the total ET including the lesion was recorded. However, if the subendometrial fibroid was clearly observed, the fibroid was not included in the ET.
2. Determination of bilateral uterine arteries
After setting a sagittal profile of the midline of the uterus, the anatomical image was defined and the imaging spectrum of the UtA was analyzed, which was characterized by a continuation with a systolic crest (prediastolic defect) and the rest of the diastolic outflow. Analysis of the emitted sound spectrum was also valuable for differentiating the UtA from pelvic vessels [15].
Determination of the bilateral uterine arteries was based on the anatomical position, color Doppler image spectrum, and sound spectrum. The probe was inserted into the vaginal fornix, which determines the position of the uterus to select the appropriate transducer position. The probe was then moved to observe the vascular plexus besides the cervix. Color Doppler was activated, and the UtA was identified because it was directed upward towards the body of the uterus. Pulsed-wave Doppler flow mapping was performed at this location before the artery branched into the arcuate arteries [16]. The Doppler window was opened from 1.5–2.0 mm. The Doppler angle between the ultrasound beam and the vascular direction was <20°. RI, PI, and PSV index were automatically calculated from three consecutive waveforms (Fig. 2).
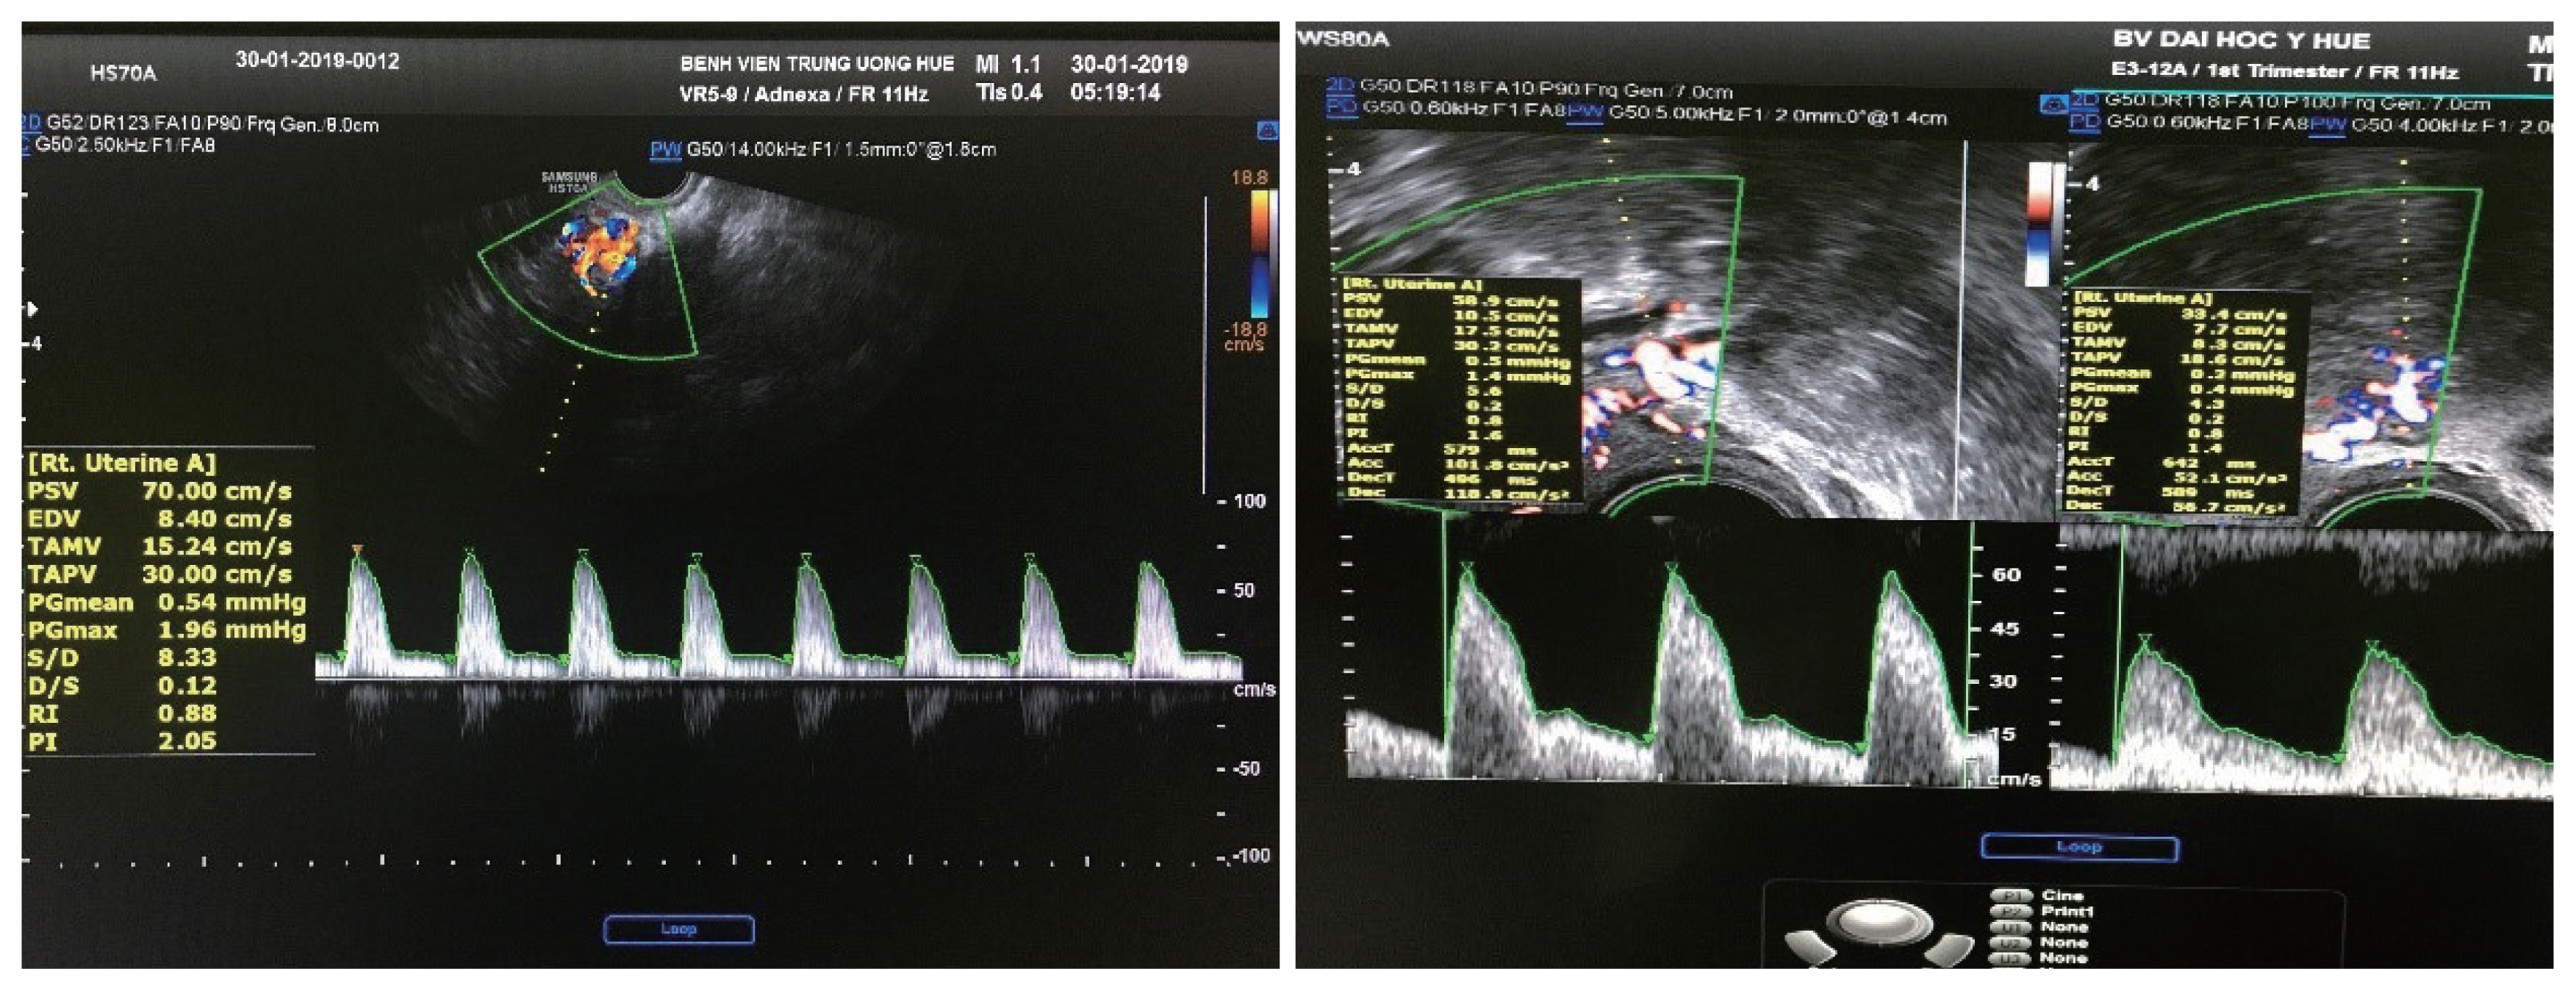
Determination of bilateral uterine arteries the Doppler window was opened from 1.5–2.0 mm. The Doppler angle between the ultrasound beam and the vascular direction was <20 degree. RI, PI, and PSV index were automatically calculated from three consecutive waveforms. RI, resistance index; PI, pulsatility index; PSV, peak systolic velocity.
Doppler hemodynamic parameters (RI, PI, and PSV) are continuous variables, calculated from the bilateral uterine arteries and rounded to two decimal places. EC, endometrial hyperplasia, polyps, subendometrial fibroid, and others (endometrial hemorrhage and endometritis) were nomenclature variables, and data collection was based on the Doppler transvaginal ultrasound and histopathological results.
Endometrial hyperplasia includes typia and atypia according to the World Health Organization 1994 (WHO94) [17].
The endometrial grade was based on the degree of glandular differentiation. Grade 1 tumors exhibit ≤5% solid non-glandular and non-squamous growth; grade 2 tumors 6% to 50%; and grade 3 tumors >50%. These results were recorded from the histopathological endpoint [18]. The stage of EC was evaluated according to the classification of the International Federation of Gynecology and Obstetrics (FIGO) (2009), then followed by surgery [19].
3. Statistical analysis
Statistical analyses were performed using the Statistical Package for the Social Sciences (SPSS) version 20.0 (IBM Corp., Armonk, NY, USA). Data were expressed as frequency (n), percentage (%), and X̄±standard deviation following the standard distribution of data. A comparison between two mean values was performed using Student’s t-test. P-value <0.05 was considered to be statistically significant.
The ranges for the area under The optimal threshold for prediction of endometrial cancer was determined using a receiver operating curve (ROC) curve and Youden Index curve (AUC) values were as follows: 0.9–1.0, excellent; 0.8–0.9, very good; 0.7–0.8, good; 0.6–0.7, satisfactory; and 0.5–0.6, unsatisfactory. The cut-off point with the highest sensitivity (Se) and specificity (Sp) was chosen.
The correlation coefficient (r) between two variables was calculated using Pearson’s correlation in linear regression. The value “r” was presented from “−1” to “+1”. The result of “−1” indicated a negative correlation, and the result of “+1” indicated a positive correlation. The ranges of the value “r” were defined as follows: | r |>0.8, strong correlation; 0.4≤| r |<0.8, moderate correlation; and | r |<0.4, weak correlation.
Results
Table 1 of the 60 cases, pathological findings revealed 23 cases of EC and 37 cases of benign pathologies. The mean age was 57.97±7.43 years, ranging from 45 to 80 years. In the present study, endometrial samples were collected from clinical interventions such as endometrial biopsy, hysteroscopy, and hysterectomy. Endometrial biopsy was the most commonly performed procedure. The mean thickness of endometrium in the malignant group was greater than in the benign group (24.18±10.58 mm and 9.43±6.61 mm, respectively, P<0.0001). The mean values of RI, PI, and PSV in the malignant group were significantly lower than those in the benign group (P<0.0001). ET accurately predicted EC in postmenopausal women (AUC, 0.89; 95% confidence interval [CI], 0.79–0.99; P<0.01). In women with PMB, using the cut-off level of an ET more than 12.5 mm, the sensitivity and specificity were 93.8% and 77.8%, respectively.
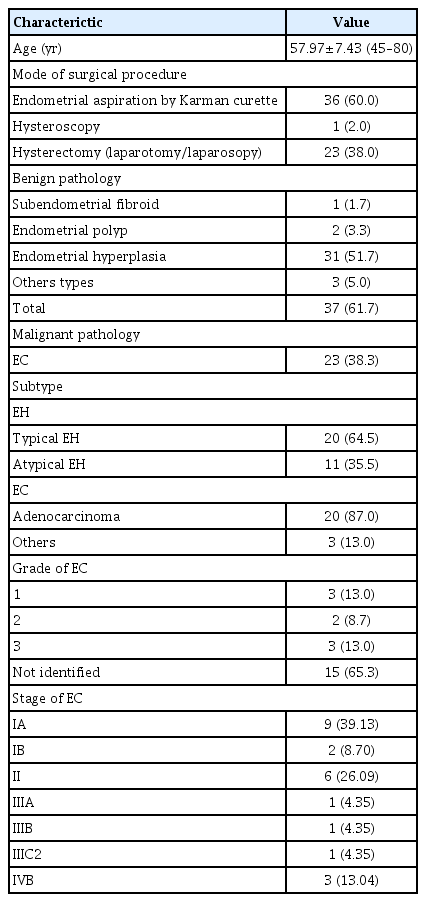
Characteristics of study population
The mean value of ET in the stage I of EC group was smaller than that in the stage II–IV of EC group, (19.88±7.17 [6–28] mm and 29.71±12.75 [13–46] mm, respectively, P=0.02). ET and EC stage were positively correlated with the average coefficient of “r”=0.48 (P=0.06). Both RI and PI accurately predicted the prognosis of EC, unlike PSV. The AUC (upper limit-lower limit) of RI, PI, and PSV index was 0.88 (0.78–0.98), 0.85 (0.74–0.97), and 0.72 (0.58–0.85), respectively (P<0.005). In PMB women, using the cut-off points of RI ≤0.73 and PI ≤1.42, the sensitivity and specificity was 91.3% and 83.8%, respectively (Table 2).

Cut-off of the RI, PI, and PSV index of the uterine artery by TV-CDU in predicting endometrial cancer
The mean RI at stage II–IV of EC was lower than that of stage I 0.53±0.12 (0.31–0.72) and 0.65±0.17 (0.36–0.90), respectively (P=0.03). Similarly, the mean PI was 0.97±0.26 and 1.51±0.86 at stage II–IV and stage I of EC, respectively (P=0.03).
RI and PI were negatively correlated with moderate levels according to EC stage I and stage II–IV, with a coefficient r of “−0.46” (P=0.03) and “−0.55” (P=0.007), respectively. The correlation coefficient “r” between the RI value and ET was “−0.47” (P<0.0001) in the study, and “−0.32” (P=0.23) in the malignant group. The correlation coefficient “r” between the PI value and the ET was “−0.43” (P=0.001) in the study, and “−0.39” (P=0.13) in the malignant group.
Discussion
In our study, we found a substantial difference in the ET between the benign and malignant groups (Table 3). In the malignant group, ET was higher than in the benign group (24.18±10.58 mm vs. 9.43±6.61 mm, respectively, P<0.0001). In the EC group, the largest ET was 46 mm and the smallest was 6 mm. The largest and smallest ET in the benign group were 35 mm and 2 mm, respectively. Similar to the study by Mayuri et al. [20], ET in the malignant group was 26±12.4 mm compared with that in the benign group (10.5±4.0 mm). In 2003, Develioglu et al. [21] reported a study on 97 women with PMB and found that the mean ET was also significantly higher in the EC group than in the benign group (19.5±9.9 mm vs. 8±6.8 mm, respectively, P<0.001). Aboul-Fotouh et al. in Egypt also found a statistically significant difference in ET between the EC group (18±6 mm) and the normal endometrial group (4.6±2.08 mm) (P=0.021). Several previous studies also have reported similar results [22–24].
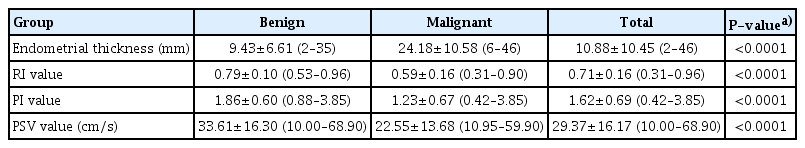
The mean value of ET, RI, and PI of uterine artery in group pathology
Based on the ultrasonographic findings in our study, there were no cases of EC with ET less than 5 mm. Similar to the study by AbdelMamoud and Elsaid. [25], all cases of malignant endometrial disease had an ET greater than 5 mm (P<0.05). In particular, we found seven cases of invasive lesions without identification of ET. In a multicenter prospective study on 930 postmenopausal women with bleeding, Ferrazzi et al. [26] found that if ET was less than 4 mm, the probability of endometrial atrophy was high, patients only needed to be followed-up, invasive measures were not required, and the diagnosis of EC was not delayed. Bano et al. [27] found a statistically significant correlation between endometrial disease and ET; there were no cases of EC with an ET of 4 mm, with 100.0% sensitivity, 13.33% specificity, 23.53% positive predictive value, and 100.0% negative predictive value (NPV). Thus, using ET can exclude EC with high confidence, avoiding endometrial biopsy for many women with PMB with an ET <4 mm; however, it cannot distinguish between the benign and malignant groups with a thickness >4 mm (P<0.05) [3,27]. Aboul-Fotouh et al. used the threshold of 5 mm for endothelial thickness as the cut-off value to predict EC with the sensitivity, specificity, positive predictive value, and NPV of 100.0%, 51.9%, 60.9%, and 100.0%, respectively, which is similar to a study by Arslan et al. in Turkey [22,28]. Particularly, a study by Sladkevicius et al. [29] on postmenopausal women aged 46 to 85 years found that out of 138 cases, there were 23 EC cases. The study used the cut-off value of 14 mm to differentiate between the benign and malignant groups, with a sensitivity of 88.0% and specificity of 81.0%; if the cut-off value of 8 mm was selected to distinguish between the normal endometrium and pathological endometrium, the sensitivity and specificity were 75% and 76%, respectively, which is similar to that reported by Park et al. [30]. Recently, Li and Li. [23] used the threshold of ET at 12 mm to diagnose EC in 488 cases with ET more than 5 mm (5–30 mm), with an AUC of 0.716 (95% CI, 0.534–0.897; P=0.019). Fig. 3 shows that the value of ET could help distinguish benign and malignant pathology in postmenopausal women with an AUC of 0.89 (95% CI, 79.5–99.5%; P<0.01). In women with PMB, when using the cut-off value of an ET to more than 12.5 mm, the sensitivity and specificity were 93.8% and 77.8%, respectively. In 2018, the American College of Obstetricians and Gynecologists (ACOG) reported the cut-off values of ET, which are presented in the following Table 4.

Receiver operating curve (ROC) of endometrial thickness (ET), resistance index (RI), pulsatility index (PI), and peak systolic velocity (PSV). UtA, uterine artery; EC, endometrial cancer; PMB, postmenopausal bleeding.

ACOG has concluded that in women with PMB, an ET less than 4 mm has a NPV of more than 99%, ruling out EC; therefore, there is no need to perform biopsies in such cases. In cases where the patient still had recurrent bleeding and the blind biopsy did not find any abnormalities, hysteroscopy combined with direct biopsy was recommended [31]. Breijer et al. [32] from the Netherlands also agreed with this management in their report titled “Strategies for the diagnosis of PMB”. Conversely, the cut-off value for ET in asymptomatic women was considered greater [4].
In the literature, the values of UtA_RI and PI in the malignant group were often lower than those in the benign group [24–33]. Table 3 shows that, in our study, there was a difference in UtA_RI between the benign and malignant groups. Interestingly, in the EC group, the UtA_RI had an inverse correlation with cancer stage; the later the stage, the more invasive the cancer and the lower the UtA_RI value (Fig. 4). Similarly, Fakhr et al. [34] found that the RI of the artery feeding the tumor deep into the myometrial layer was significantly lower in the invasive stage than in the non-invasive stage (0.39 vs. 0.56, P<0.001). According to Bano et al. [27], the benign endometrium group was associated with a high RI value, with a mean UtA_RI of 0.95±0.21, ranging from 0.57 to 1.8; in the malignant group, there was a low resistance in the vascular flow, and the mean value of RI was 0.77±0.14, ranging from 0.55–0.96. In a study by Mayuri et al. [20], the mean value of the UtA_RI index in the benign group was 0.66±0.19, which was significantly higher than that in the malignant group (0.33±0.03, P<0.05), and there was no difference in RI values among benign diseases.
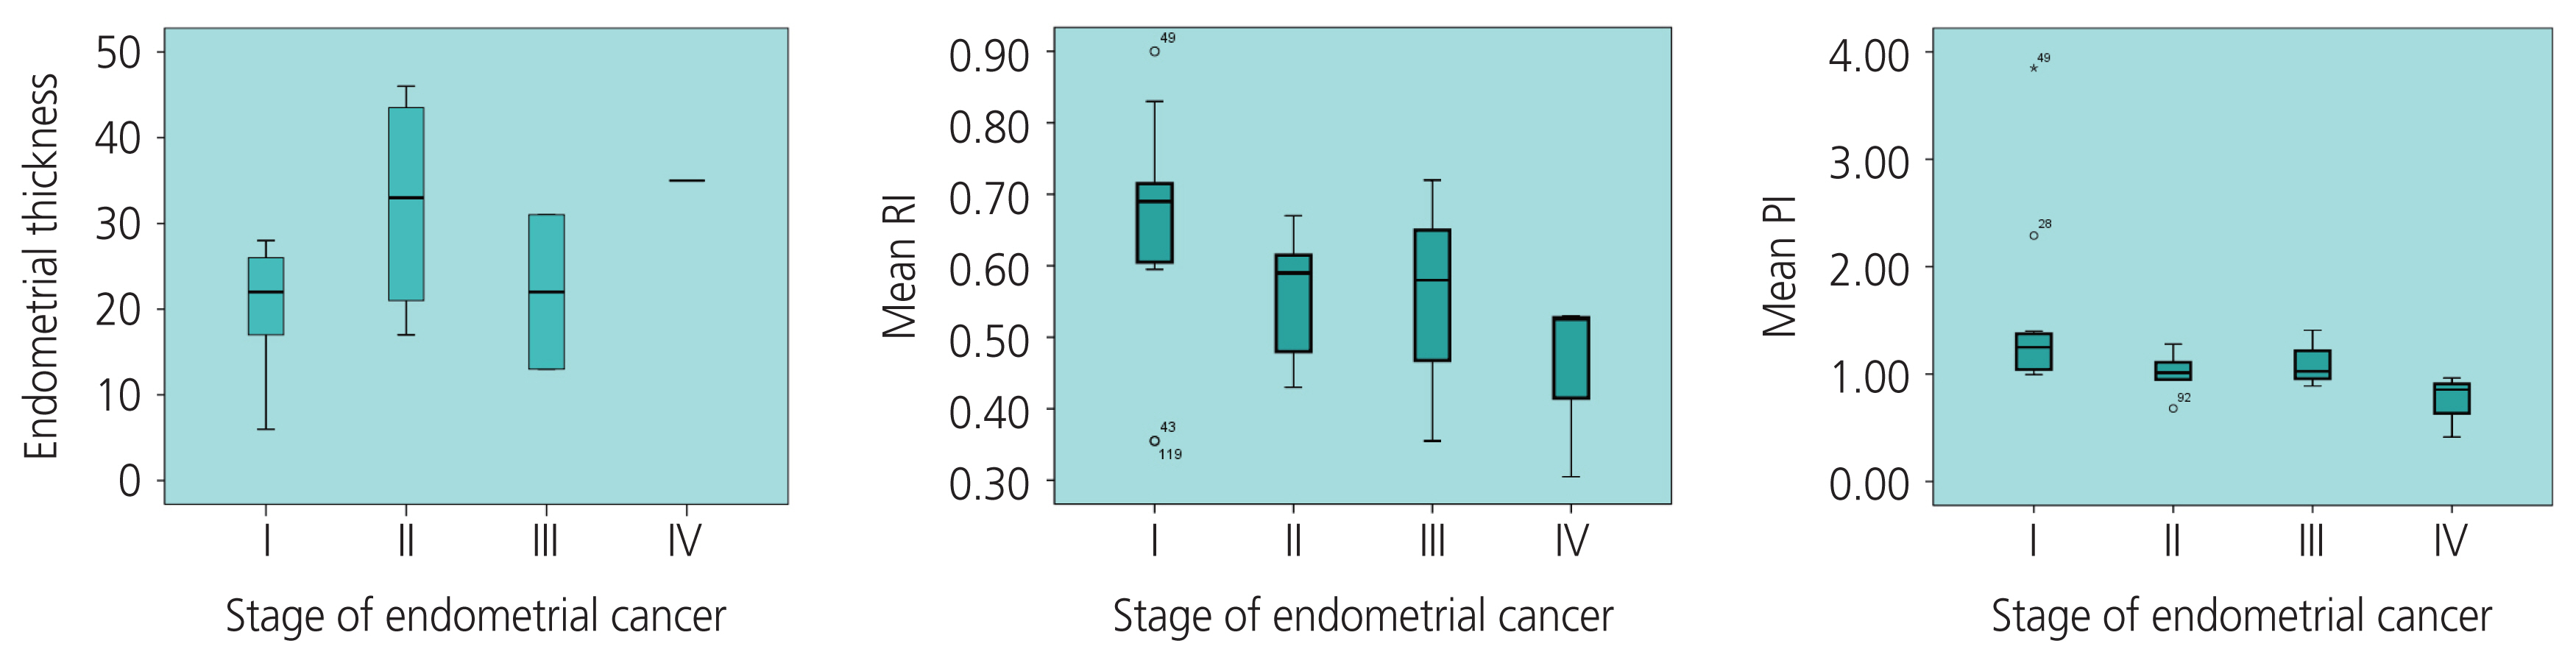
Correlation between endometrial thickness (ET), resistance index (RI), pulsatility index (PI), and the stages of endometrial cancer.
Regarding the UtA_PI index, there was also a significant difference between the benign and malignant groups. The mean UtA_PI index of the malignant group was significantly lower than that in the benign group (1.23±0.67 vs. 1.86±0.60, P<0.0001) (Table 5). Our results were similar to the those of other studies, however, the diagnostic value was still different from these other studies. AbdelMaboud and Elsaid. [25] compared the UtA_PI values of three groups of cancers, hyperplasia, and subendometrial fibroids; the values were 0.67, 1.31, and 0.81, respectively, and the UtA_PI in the neoplastic group was significantly lower. Similarly, in a study by Mayuri et al. [21], the mean PI value in the benign group was 0.92±0.27, which was significantly higher than that in the malignant group (0.45±0.15, P<0.05).
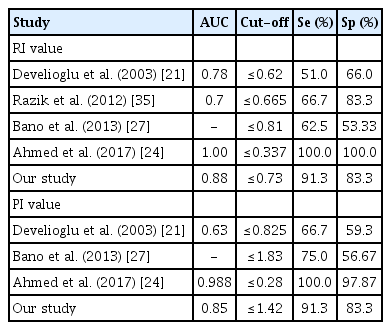
Comparison of diagnostic value of UtA_RI and PI in some studies
In the EC group, our study also found that the PI value was associated with the stage of EC; the later the stage, the lower the UtA_value (Fig. 4), which was similar to the findings of De Smet et al. [36] and Ahmadzade et al. [11]. The diagnostic values of the RI and PI were better than those of the PSV (Table 5). The diagnostic value of the RI was not significantly higher than that of the PI. Several studies also reported that UtA_RI had a better value than UtA_PI in the diagnosis of malignancies, whereas Bezircioglu et al. [37] reported differently. Our study also found a negative correlation between the ET, RI, and PI (Fig. 5).
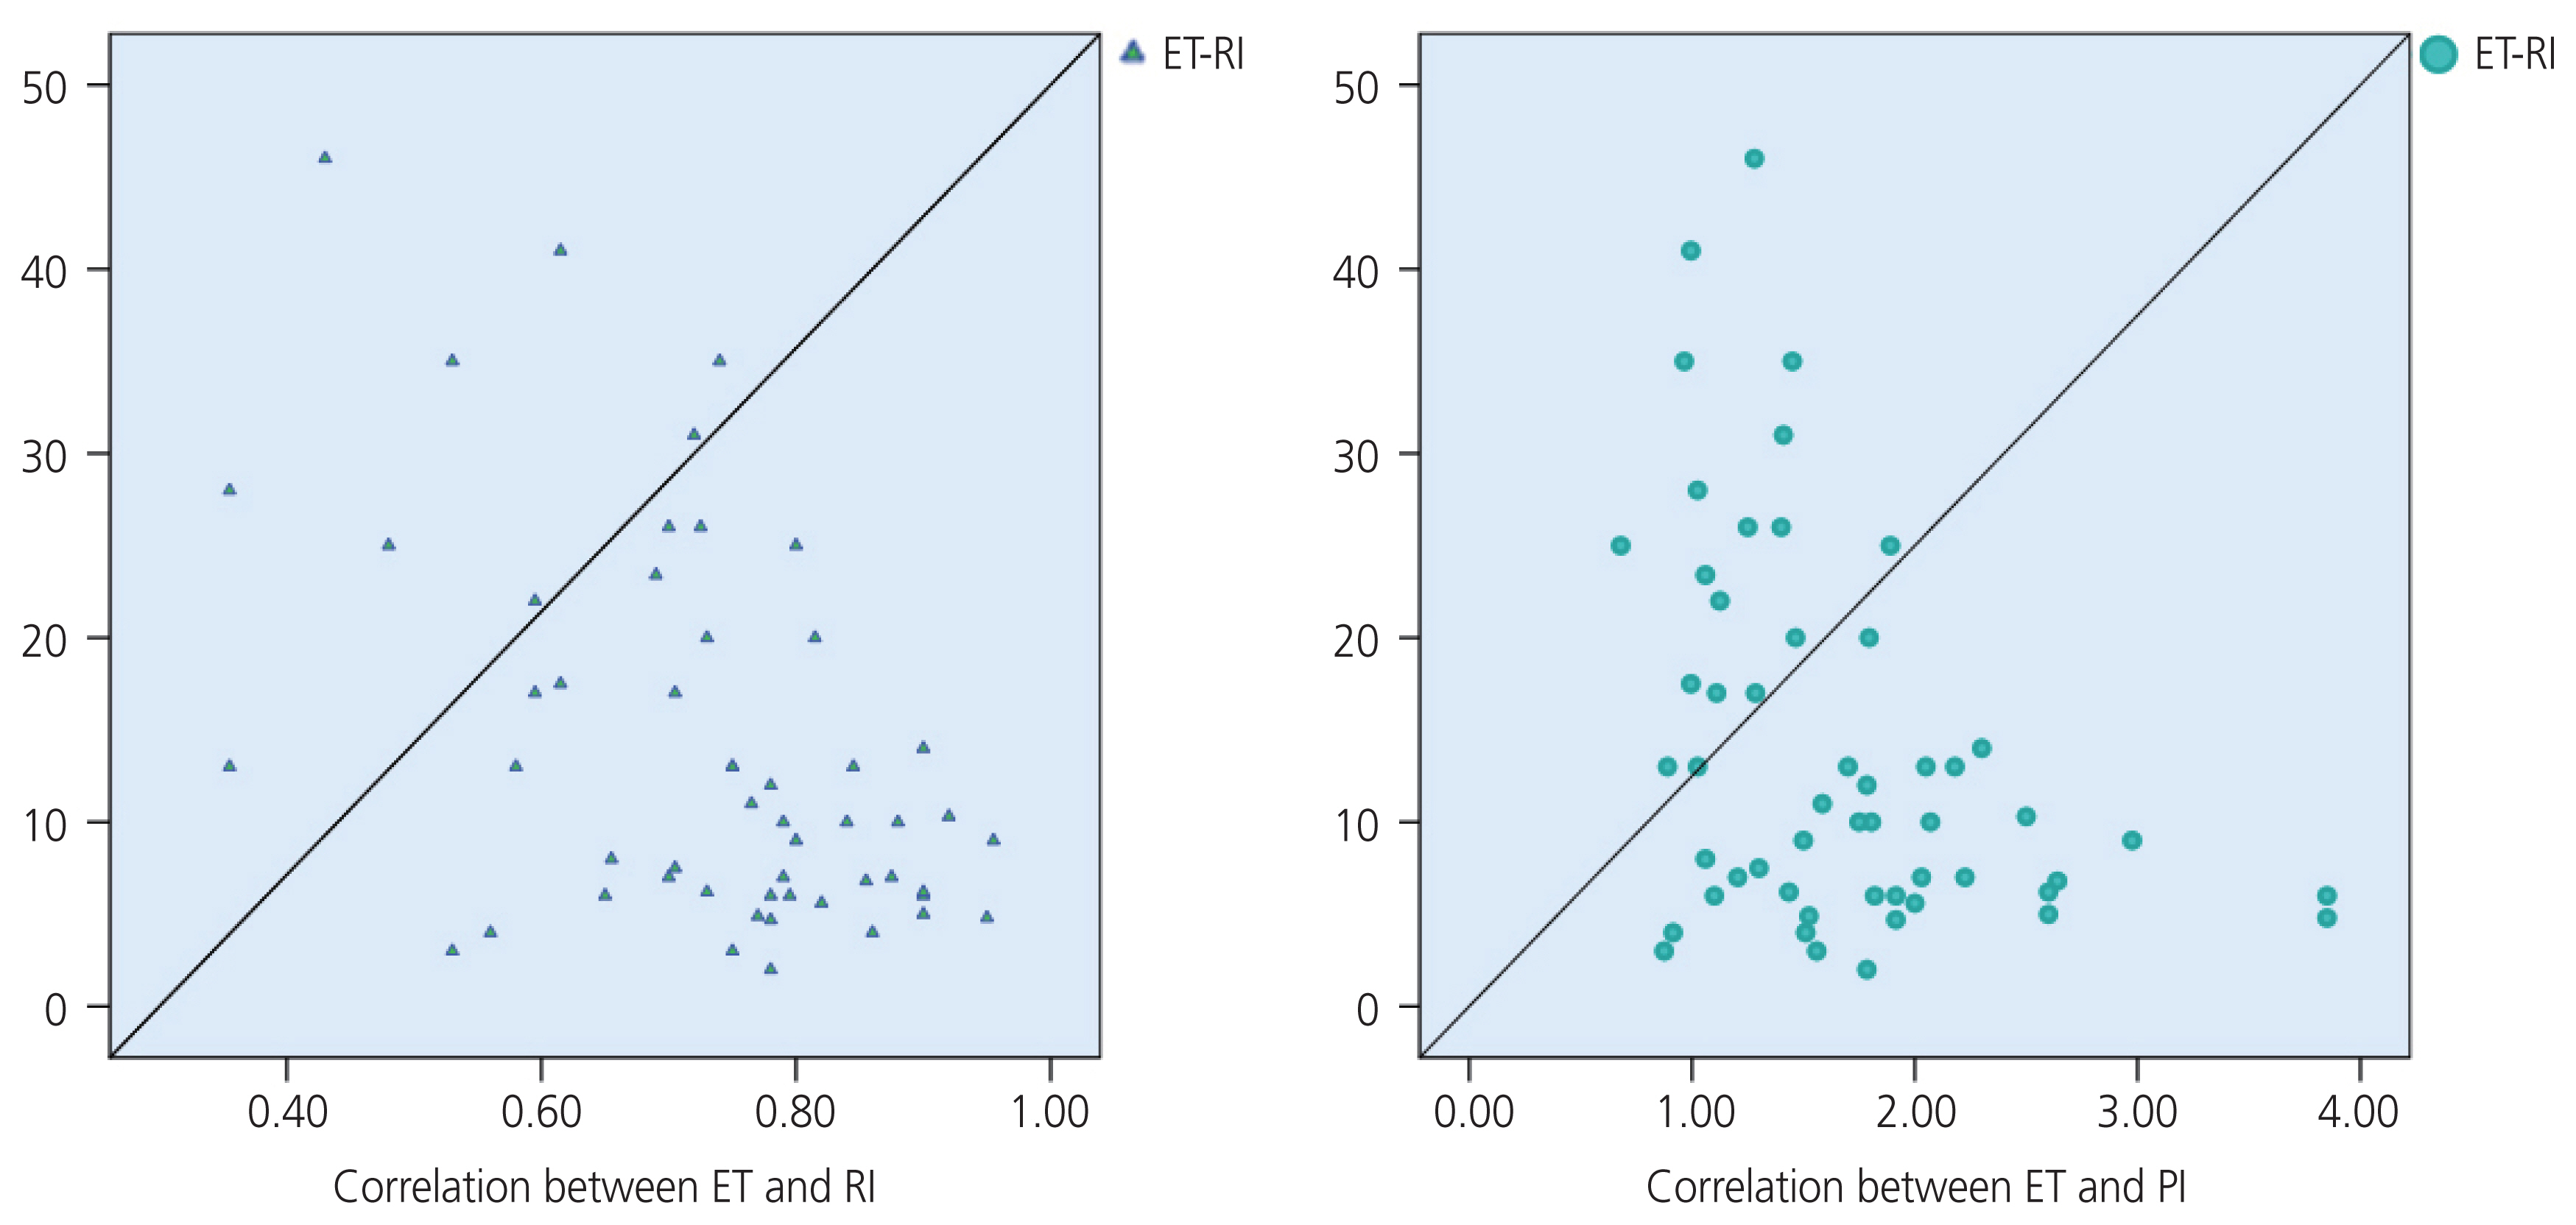
Correlation between endometrial thickness (ET), resistance index (RI), and pulsatility index (PI).
1. Limitations of study
As mentioned above, the present study depended on the clinical indications. Therefore, we could not conduct the histopathological investigation for all cases with an ET less than 4 mm. Moreover, we did not accurately analyze the endometrial thickness or Doppler UtA indices in association with the subtypes of EC and hyperplasia. The sample size of the study population was too limited to provide strong evidence. Further studies are needed to robustly demonstrate the optimal cut-off values of ET, RI, PI, and PSV index.
2. Future study
Recently, several studies have mentioned the role of serum cancer antigen (CA)-125 in predicting EC [38,39]. Therefore, we hope to develop a better study design in order to provide predictive modeling of EC and cancer stage based on well-known clinical risk factors (body mass index, postmenopausal age, hypertension, and diabetes) combined with endometrial thickness, Doppler UtA indices, and CA-125 [40].
Endometrial thickness is a good predictive value of EC in postmenopausal women with AUB. RI, PI, and PSV index of the UtA were significantly lower in the malignant group than those in the benign group. Additionally, in the later stage of EC, RI and PI were lower than the PSV index.
Acknowledgments
We thank the patients who agreed to participate in our study and let us publish the clinical data. The authors are also grateful to all the teachers and colleagues working in the Department of Gynecology, Department of Imagine Diagnostic, and Department of Histopathology at Hue Central Hospital and Hue University Hospital. We are thankful for Van Duc Vo, Ph.D, M.D, Thao Nguyen Nguyen Tran, Ph.D, M.D., Ngoc Ty Nguyen Thi, M.D., Diem Thu Nguyen Thi, M.D., Phuong Minh Dinh Thi, M.D., and Thanh Thuy Tran Thi, M.D. They have all provided us with pictures, provided care for the patients, and shared their precious experiences related to managing this clinical course with us.
Notes
Conflict of interest
No potential conflict of interest relevant to this article was reported.
Ethical approval
This study was approved by the ethical committee of the institution (IRB approval number 1435/QĐ-ĐHYD).
Patient consent
Written informed consent was obtained from the patients for recruitment in the study.
Consent for publication
An understandable publication consent was obtained from both authors. This study has not been previously published.
Availability of data and materials
The datasets used and/or analyzed during the current study are available from the corresponding author upon reasonable request.
Author’s contributions
Phuc Nhon Nguyen contributed to the concept of the content, organized the method, collected the data, and analyzed, wrote, and edited the manuscript. Van Tuan Nguyen was responsible for the supervision. Both authors have read and approved the final manuscript.
Funding information
The research did not receive any financial support.