Obstet Gynecol Sci Search

CLOSE


Obstet Gynecol Sci > Volume 66(5); 2023 > Article
Choo, Lee, Lee, Lee, Park, Park, Cho, and Choi: Transcriptomic patterns in early-secretory and mid-secretory endometrium in a natural menstrual cycle immediately before in vitro fertilization and embryo transfer

Abstract

Objective

This study aimed to evaluate the endometrial transcriptomic patterns in the early secretory phase (ESP) and mid-secretory phase (MSP) of the natural menstrual cycle before in vitro fertilization and embryo transfer (IVF-ET).

Methods

Thirty patients whose endometrial tissues were obtained from the ESP or MSP of a natural menstrual cycle immediately before IVF-ET were included. Endometrial dating was histologically confirmed as ESP (cycle days 16-18) or MSP (cycle days 19-21), according to the noyes criteria. The patients were divided into two groups depending on the IVF-ET outcome: pregnant (n=14; 7 in ESP and 7 in MSP) or non-pregnant (n=16; 8 in ESP and 8 in MSP). Differentially expressed genes (DEGs) in the MSP, compared to the ESP, were identified using NanoString nCounter (NanoString Technologies, Seattle, WA, USA) data for both the pregnant and non-pregnant groups.

Results

Thirteen DEGs in the pregnant group and 11 DEGs in the non-pregnant group were identified in the MSP compared to those in the ESP. In both groups, adrenoceptor alpha 2A, interleukin 1 receptor-associated kinase 2, a disintegrin and metalloproteinase with thrombospondin repeats 15 (ADAMTS15), serpin family E member 1, integrin subunit beta 3, transmembrane protein 252 (TMEM252), huntingtin associated protein 1, C2 calcium-dependent domain containing 4A, and integrin subunit alpha 2 were upregulated in the MSP, compared to the ESP. TMEM37, galactosidase beta 1 like 2, Rho family GTPase 3, and cytochrome P450 family 24 subfamily A member 1 were upregulated in the MSP only in the pregnant group. ADAMTS8 was downregulated and monoamine oxidase A was upregulated in the MSP only in the non-pregnant group.

Conclusion

Transcriptomic patterns in the endometrium immediately before IVF-ET appear to differ according to the IVF-ET outcome. These novel DEGs, which have not been previously studied, may have functional significance during the window of implantation and serve as potential biomarkers of endometrial receptivity.

Introduction

Successful implantation requires a competent blastocyst, a receptive endometrium, and adequate crosstalk between the two. In humans, fecundability is poor (20-25%), and approximately 75-80% of pregnancy failures result from implantation failure [1]. The human endometrium undergoes dynamic changes, with menstrual breakdown and subsequent regeneration during each menstrual cycle [2]. Intricate changes at the tissue, cellular, and molecular levels during each menstrual cycle are required to create a period of receptivity for blastocyst implantation [3,4]. This period of receptivity is known as the “window of implantation (WOI)”, a term first used by Edwards to describe the human uterus [5]. The WOI is a short period that begins on day 19 or 20 of the menstrual cycle and persists for 4-5 days [2,6].
Since histological assessment of the endometrium is insufficient to predict the receptivity for embryo implantation [7], investigations have focused on examining the molecular physiology of the WOI in the human endometrium. Consequently, several biomarkers have been suggested as uterine receptivity markers including hormone receptors, biochemical markers, and immunohistochemical markers [8,9]. Given the complexity of endometrial-regenerating tissues and recent advances in microarray technology, researchers have begun to use transcriptomics to characterize endometrial changes [4,10], especially for assessing endometrial receptivity [11]. The endometrial receptivity array (ERA) is a bulk-tissue transcriptomic analysis method that involves the retrieval of a small amount of tissue from endometrial biopsies in the WOI. This array has been used to schedule embryo transfers in clinically selected women undergoing in vitro fertilization and embryo transfer (IVF-ET) [12,13]. The ERA is a customized microarray containing 238 genes that are differentially expressed during different phases of the menstrual cycle. This transcriptomic signature allows prediction of WOI displacements and identification of the endometrial receptivity status as “receptive” or “non-receptive”, findings that can be used to guide personalized embryo transfer (pET) [12].
Nevertheless, questions remain regarding the clinical benefits of ERA and whether ERA testing increases the success rate of pET. Some studies have shown higher rates of implantation and ongoing pregnancy in patients who underwent ERA-based management [14,15], while others have not [16-18]. Although ERA testing significantly increased the cumulative pregnancy rate in a randomized controlled trial of patients with infertility, it did not change the first-attempt success rate when compared with standard procedures involving transfers of fresh or thawed embryos [19]. Emerging evidence has shown that pET based on ERA does not improve pregnancy rates and may negatively affect reproductive outcomes [20]. These negative effects have been attributed to the presence of more variations in transcriptomic endometrial signatures than previously reported, with ERA testing leading to inaccurate recommendations regarding embryo transfer, as well as harmful progesterone exposure because of the increased duration before embryo transfer [20].
As studies on the transcriptomic signatures of the WOI have reported differing results [21], further transcriptomic research evaluating the optimal endometrial receptivity is warranted. Biological processes and molecular participants in the transition from the early secretory (ES) phase to the mid-secretory (MS) phase of the endometrium underscore the complex events involved in preparation for embryo implantation. Previously reported genes with altered expression during the endometrial transition from the ES to the MS phase were frequently involved in ion binding, cell cycle regulation, transport of signaling proteins, and immune modulation [22]. Although several studies have compared gene expression in the receptive (i.e., MS) and pre-receptive (ES) phases in an attempt to identify the molecular signature characteristic of a receptive endometrium [22-25], no consensus has been reached regarding the genes accounting for transcriptomic differences between phases.
Therefore, we conducted this study to evaluate endometrial transcriptomic patterns in the ES and MS phases of the natural menstrual cycle before IVF-ET and to compare differences in differentially expressed genes (DEGs) according to subsequent IVF-ET outcomes (pregnancy or no pregnancy).

Materials and methods

1. Study population

Thirty patients aged 29-40 years who underwent IVF-ET were included in this study. To exclude embryonic effects on implantation, only patients who underwent the transfer of ≥1 high-quality embryo were included. Embryos with ≥6 blastomeres (development grade I/V or II/V on day 3) were considered to be morphologically of high quality. Patients with adenomyosis, submucosal or endometrial-distorting uterine myomas, endometrial hyperplasia, endometrial cancer, endometrial polyps, inflammatory diseases, infectious diseases, malignancy, cardiovascular diseases, or autoimmune diseases were excluded from this study.
Endometrial samples were obtained from the included patients using a Pipelle catheter (Cooper Surgical, Trumbull, CT, USA) during the ES or MS phases of the natural menstrual cycle immediately before IVF-ET. Endometrial dating was histologically confirmed as the ES phase (days 16-18 of the menstrual cycle) or the MS phase (days 19-21 of the menstrual cycle), according to the Noyes criteria. We divided the patients into two groups depending on the IVF-ET outcome: pregnant group (n=14; 7 in ES and 7 in MS) and non-pregnant group (n=16; 8 in ES and 8 in MS).
This study was approved by the Institutional Review Board of Severance Hospital (IRB No. 4-2018-0747), and informed consent was obtained from all participants.

2. Ribonucleic acid (RNA) extraction and quantification

RNA was extracted from formalin-fixed paraffin-embedded (FFPE) tissues. The samples were cut into sections with a thickness of 10 μm, and five sections were deparaffinized with xylene and rehydrated with ethanol. RNA was extracted using a High Pure FFPET RNA Isolation Kit (Roche, Mannheim, Germany) according to the manufacturer’s instructions. RNA purity and concentration were measured using a NanoDrop (Thermo Scientific, Waltham, MA, USA), and RNA integrity was assessed using an RNA 6000 Nano Chip on an Agilent 2100 Bioanalyzer (Agilent, Santa Clara, CA, USA).

3. Gene expression quantification and differentially expressed gene analysis

RNA extracted from FFPE samples was analyzed using the nCounter® analysis system (NanoString Technologies, Inc., Seattle, WA, USA) in accordance with the manufacturer’s instructions. A total of 5 μL of each RNA sample was combined with 8 μL of Codeset Master Mix containing the Reporter CodeSet and hybridization buffer. We then added 2 μL of the capture probe set, after which the contents were mixed by vortexing for 10 seconds and briefly spun down. Next, the solution was placed in a thermal cycler (Bio-Rad Laboratories Inc., Hercules, CA, USA) for 16 hours, after which the samples were moved to the prep station containing the prepared cartridges and the nCounter Master Kit. At this station, the samples were purified and bound to a cartridge. This process was completed in approximately 2.5 hours, with 12 lanes per run. The cartridges were then transferred from the prep station to a digital analyzer (NanoString Technologies), where they were scanned using a setting of 555 fields of view.
To quantify gene expression values, first, a normalization step was performed using the geNorm algorithm [26] in the nCounter Advanced Analysis version 2.0.115 (NanoString Technologies® Inc., nSolver™ Advanced Analysis Software [NanoString Technologies, Inc.]; https://www.nanostring.com/products/analysis-software/advanced-analysis). Second, the genes that were differentially expressed in the two selected biological environments were analyzed using the default option. To compare gene expression profiles, nCounter Advanced Analysis version 2.0.115 clustered the normalized gene expression values of a few hundred selected DEGs in an unsupervised manner. The software generated expression plots for each gene, as well as volcano plots showing the magnitude of change and P-values for comparisons between the two samples.
To understand the biological functions of the DEGs, we performed functional enrichment analysis using g:Profiler [27] and cluster Profiler [28]. This involved performing gene-set overlap testing and a comparison of the analyzed DEGs and a number of functionally categorized genes, including biological processes of Gene Ontology, Kyoto Encyclopedia of Genes and Genomes (KEGG) pathways, and other functional gene sets.

4. Statistical analysis

Statistical analyses were performed using Statistical Package for the Social Science, version 26.0 (SPSS Inc., Chicago, IL, USA). Patient characteristics were compared between the pregnant and non-pregnant groups using Fisher’s exact test for categorical variables and the Mann-Whitney-Wilcoxon test for continuous variables. Statistical significance was set at P<0.05.
nSolver software (freely available from NanoString Technologies) was used for mRNA data analysis. The lists of upregulated and downregulated genes were obtained and filtered using the criterion of a 2-fold change to identify DEGs. Differences in gene expression were assessed using the Mann-Whitney-Wilcoxon test, with P-values <0.05 indicating statistical significance.

Results

1. Clinical characteristics in study population

There were no significant differences in the age, parity, duration of infertility, number of previous IVF attempts, or cause of infertility between the pregnant and non-pregnant groups (Table 1).

2. Gene expression profiles of the early secretory and mid-secretory phase endometria in the pregnant group

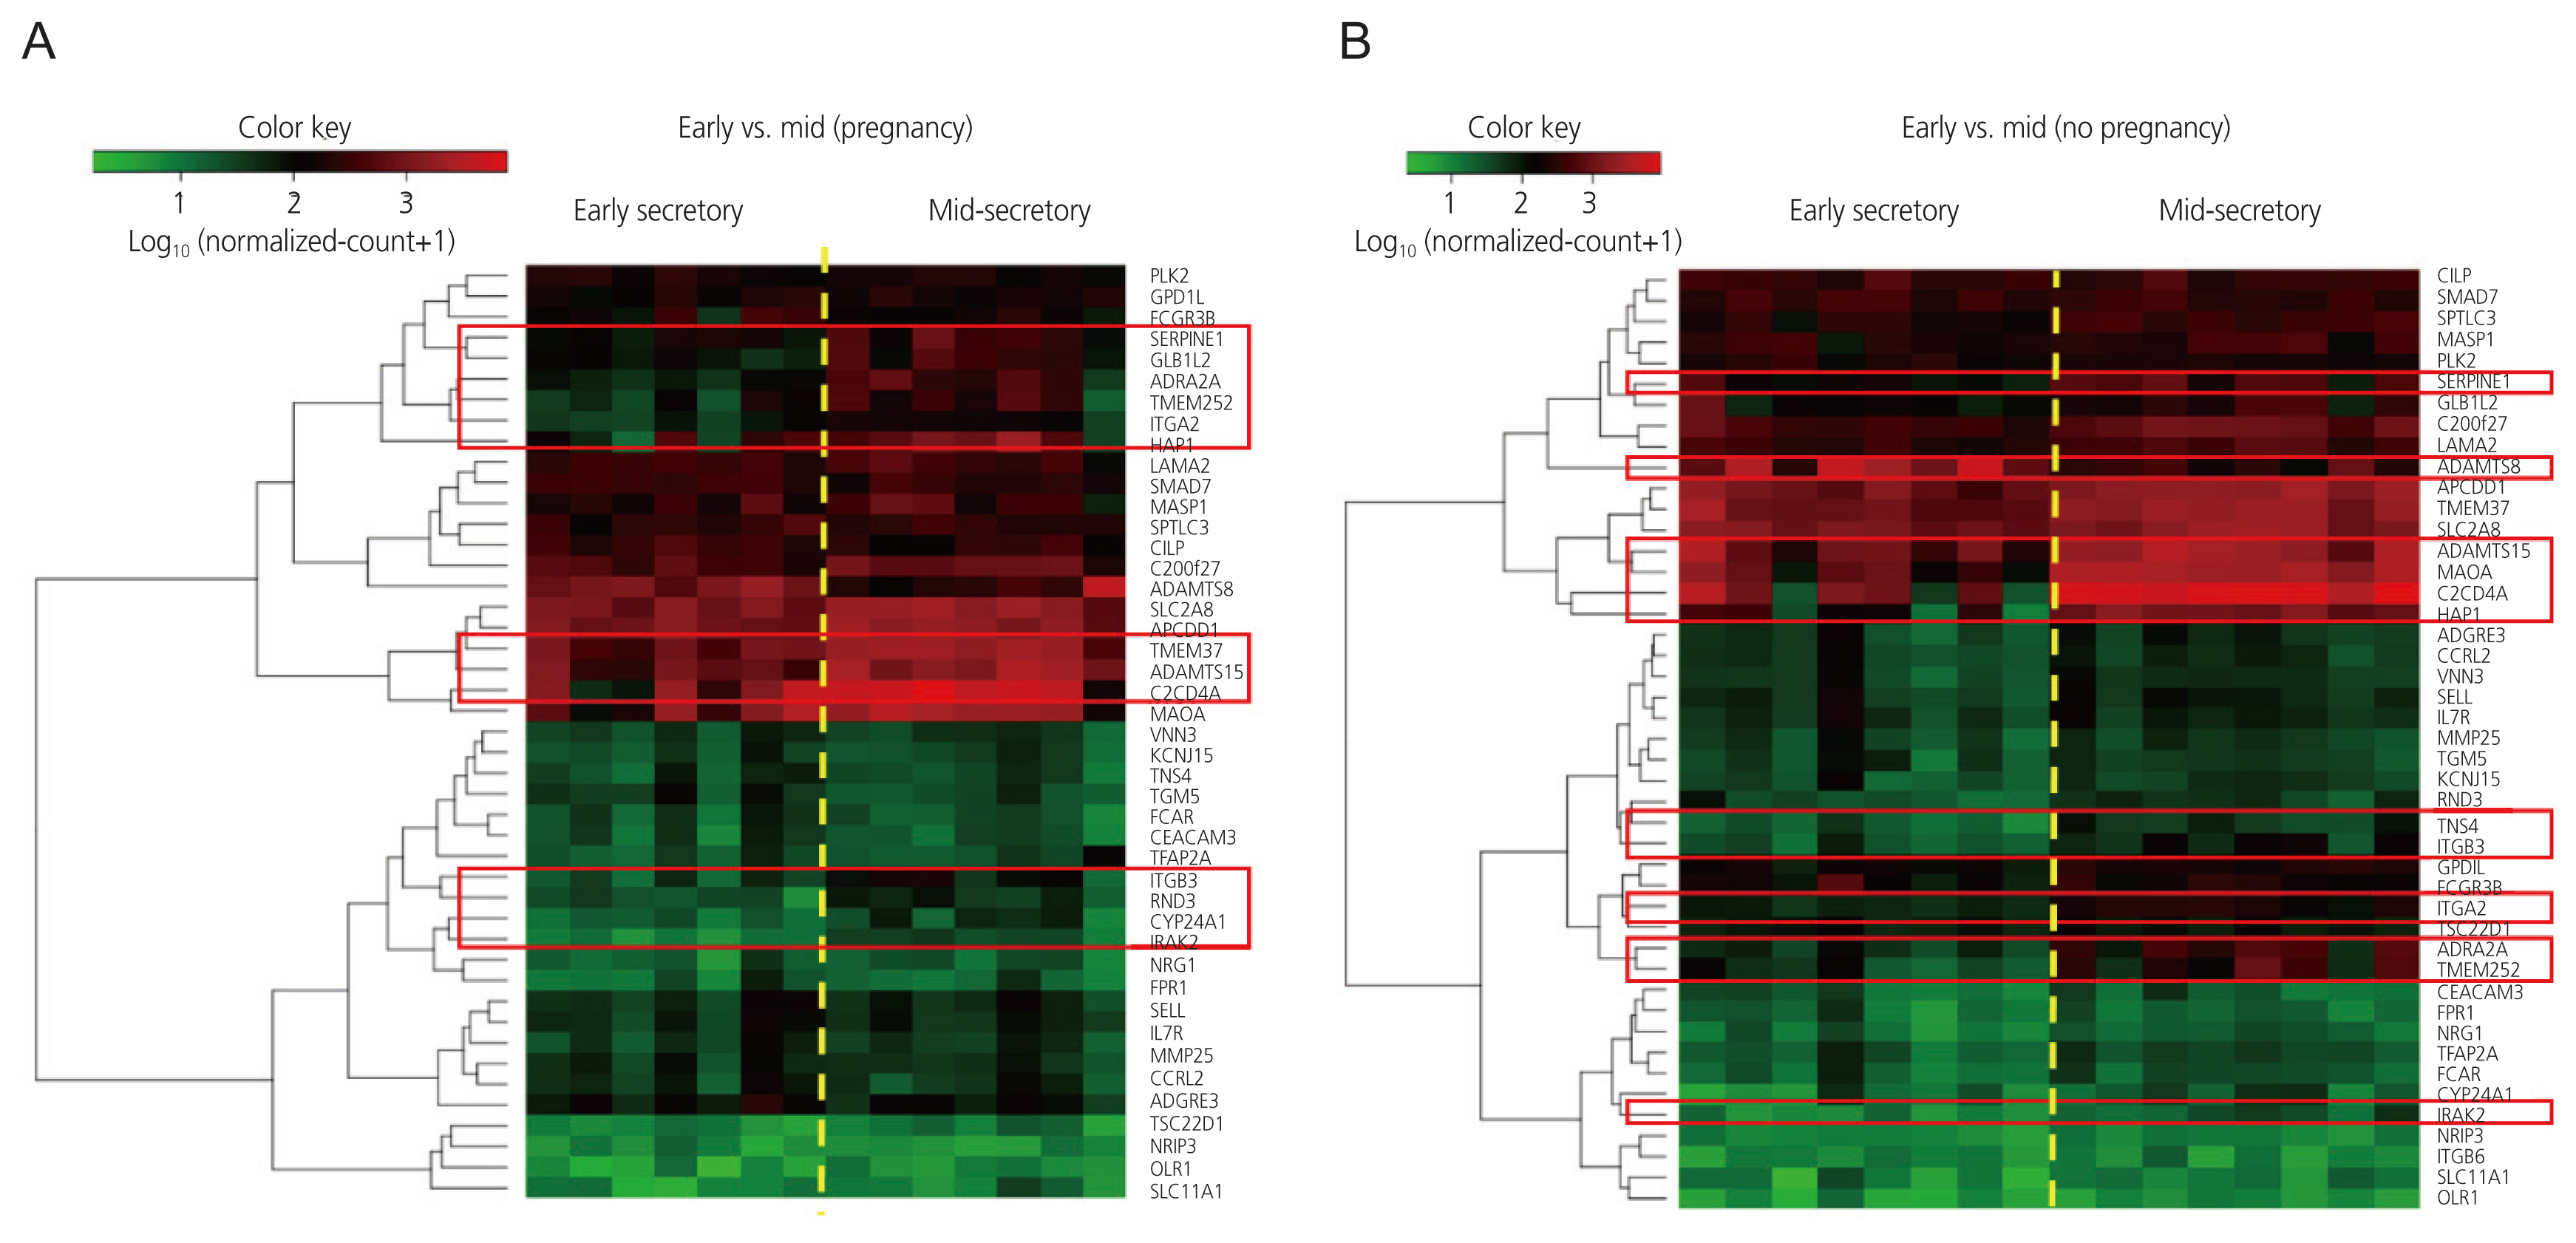
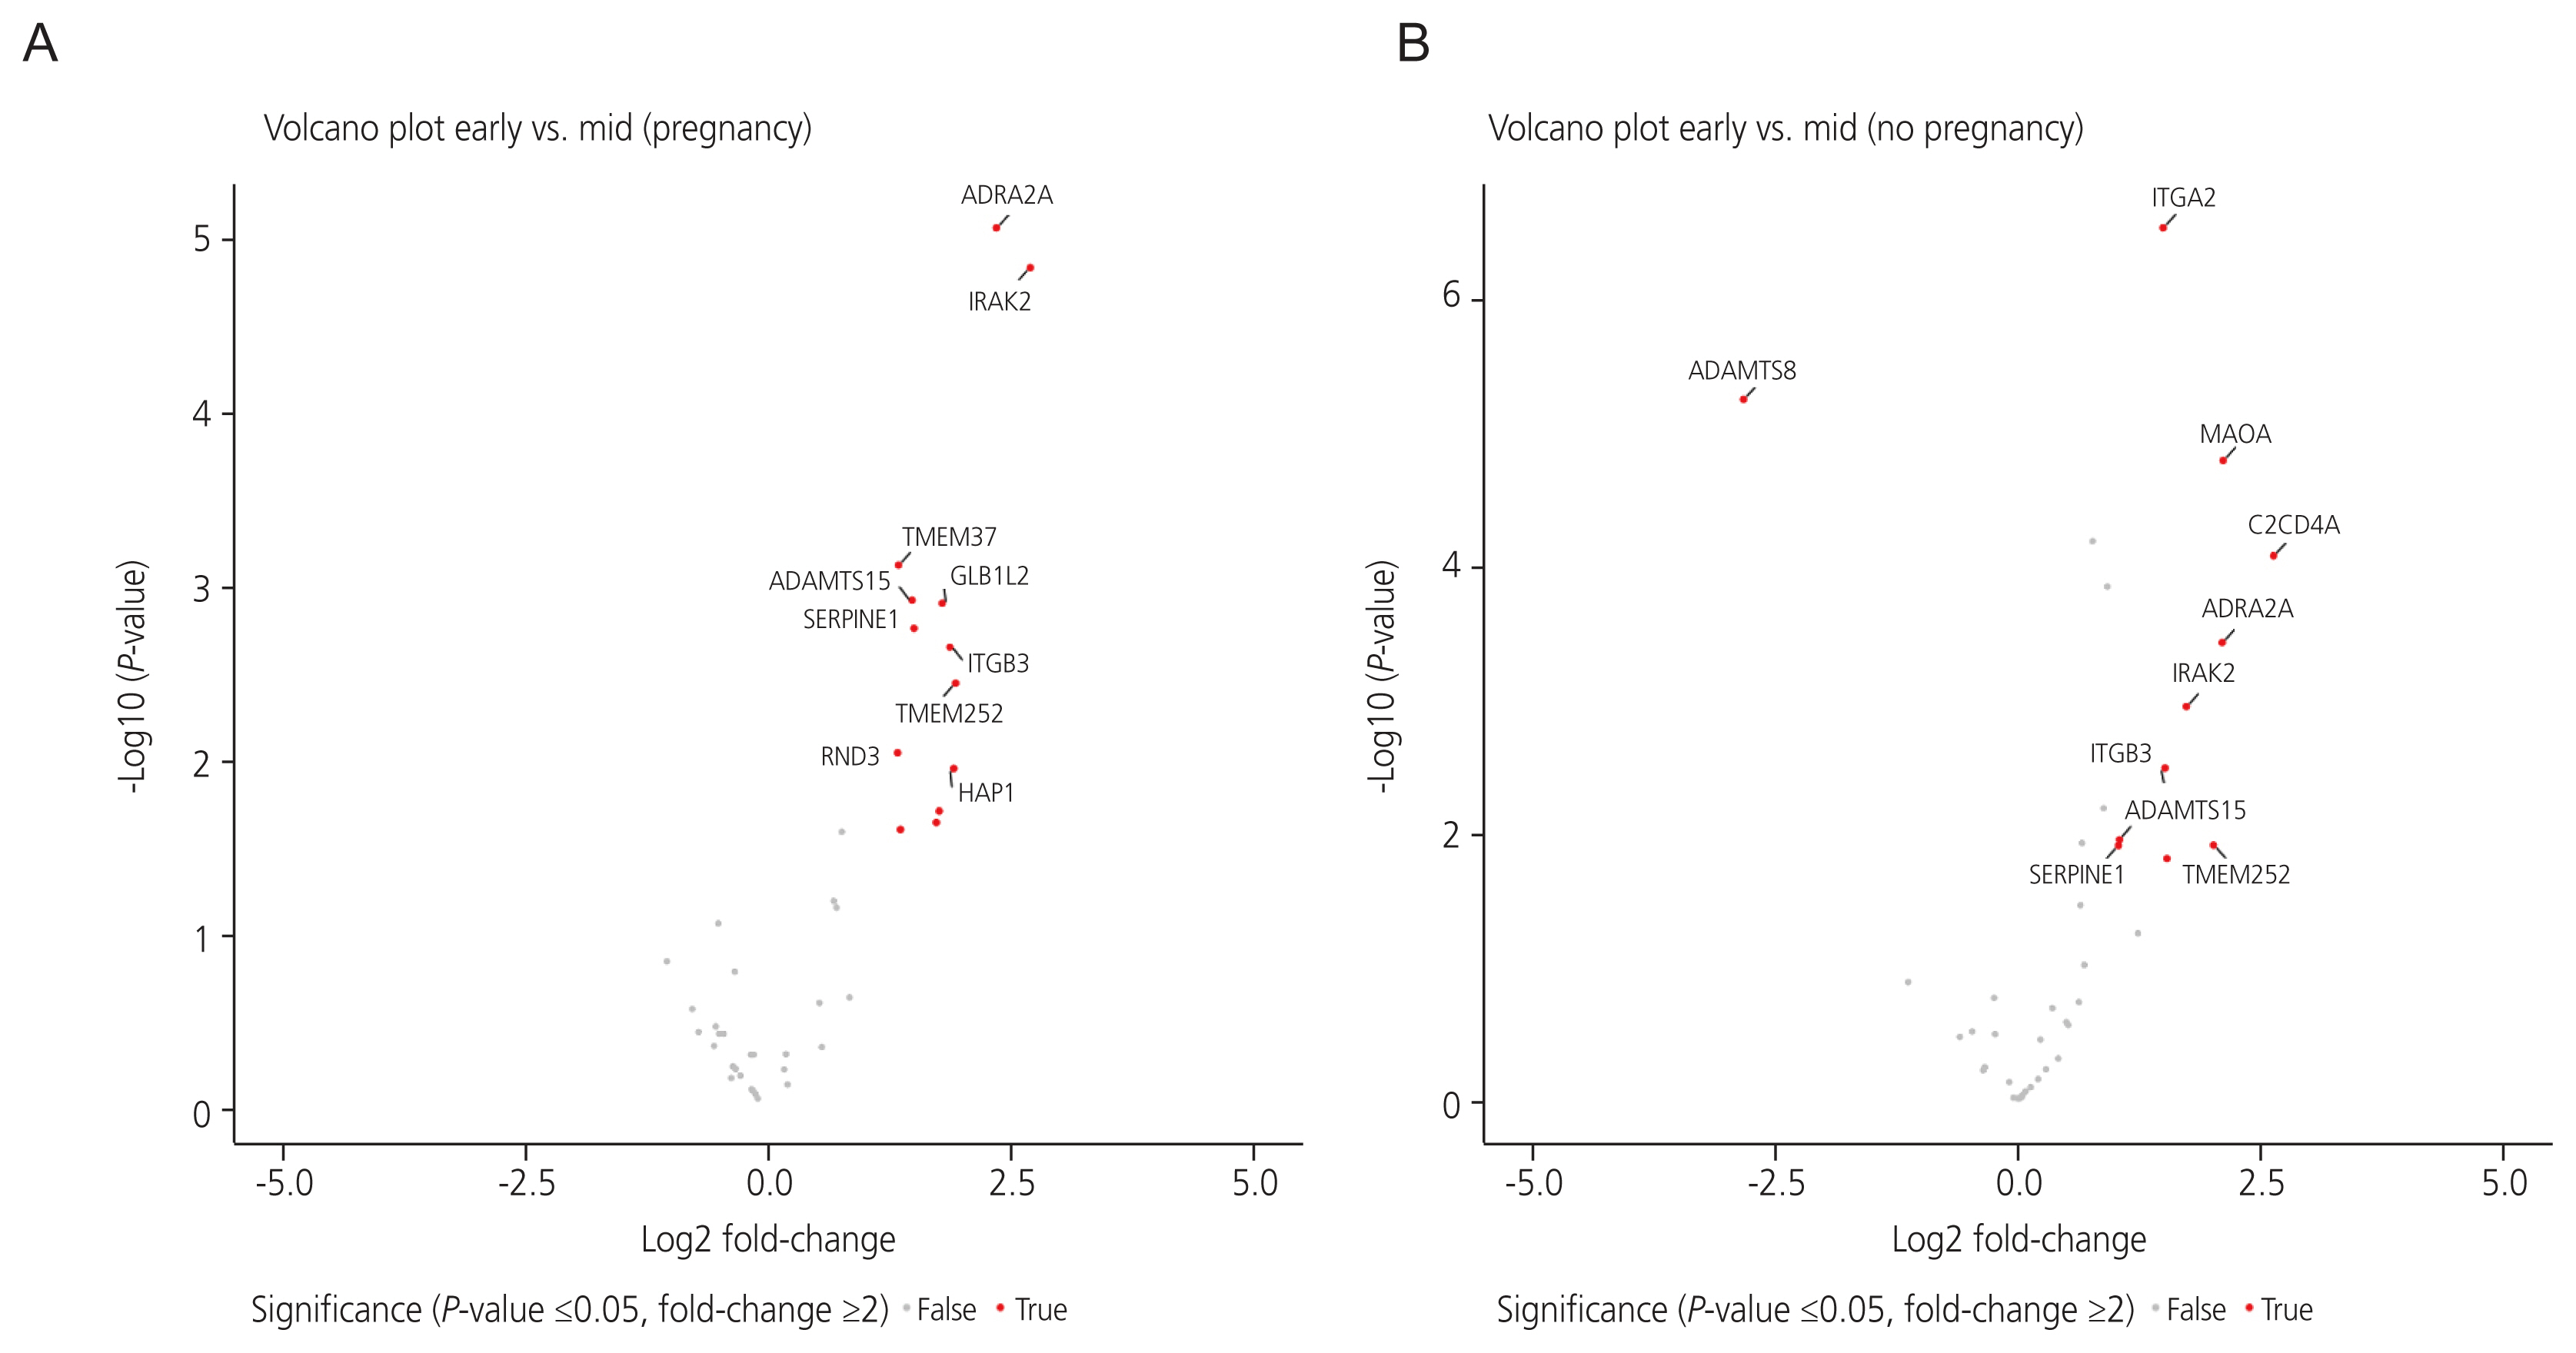
Heatmaps generated after raw data analysis revealed distinct expression profiles of upregulated genes in the MS phase endometrium compared to the ES phase endometrium in the pregnant group (Fig. 1A). The volcano plot (Fig. 2A) shows all samples plotted as a function of fold change versus P-value. Thirteen DEGs were identified when comparing the ES and MS phase endometria in the pregnant group (Table 2).

3. Gene expression profiles of the early secretory and mid-secretory phase endometria in the non-pregnant group

Heatmaps generated after raw data analysis revealed distinct expression profiles of both upregulated and downregulated genes in the MS phase endometrium versus the ES phase endometrium in the non-pregnant group (Fig. 1B). The volcano plot (Fig. 2B) shows all samples plotted as a function of fold change versus P-value. A total of 11 DEGs were identified when comparing the ES and MS phase endometria in the non-pregnant group (Table 3).

4. Comparison of gene expression patterns between pregnant and non-pregnant groups

No DEGs were found between the pregnant and non-pregnant groups in the ES and MS phases (data not shown). Nine genes were upregulated in the MS phase endometrium, compared to the ES phase endometrium, in both the pregnant and non-pregnant groups: adrenoceptor alpha 2A, interleukin 1 receptor-associated kinase 2, a disintegrin and metalloproteinase with thrombospondin repeats 15, serpin family E member 1, integrin subunit beta 3, transmembrane protein 252, huntingtin associated protein 1 (HAP1), C2 calcium-dependent domain containing 4A and integrin subunit alpha 2. In contrast, there were differences in the expression patterns of several genes between the ES and MS phases in the pregnant and non-pregnant groups. Four genes were upregulated in the MS phase endometrium, compared to the ES phase endometrium, though this was only in the pregnant group: transmembrane protein 37 (TMEM37), galactosidase beta 1 like 2 (GLB1L2), Rho family GTPase 3 (RND3), and cytochrome P450 family 24 subfamily A member 1 (CYP24A1). One gene (ADAMTS8) was downregulated and one gene (MAOA) was upregulated in the MS phase endometrium, compared to the ES phase endometrium, though this was only in the non-pregnant group. The molecular functions, biological processes, and KEGG pathways of the DEGs, with patterns that differed between the pregnant and non-pregnant groups, are shown in Table 4.

Discussion

This study showed that in a natural menstrual cycle before IVF-ET, endometrial transcriptomic patterns differed between the ES and MS phases according to IVF-ET outcomes. We identified 9 DEGs with upregulated expression in the MS phase endometrium (compared to the ES phase endometrium), regardless of whether pregnancy occurred. In contrast, TMEM37, GLB1L2, RND3, and CYP24A1 were upregulated only in the pregnant group, ADAMTS8 was downregulated, and MAOA was upregulated only in the non-pregnant group. Among these selected DEGs, some were previously reported, while others were novel.
The function of the TMEM37 protein has not yet been validated, but it may inhibit calcium influx through a subunit of calcium channels and may be related to insulin release [29]. It may also be associated with the prognosis of patients with colon cancer [30]. The GLB1L2 protein is a galactosidase with beta-galactosidase activity that is involved in carbohydrate metabolic processes [31]. However, its physiological function remains largely unknown.
The RND protein is a member of the Rho family, a group of proteins that was first characterized by their ability to induce loss of cell-substrate adhesion, followed by cell rounding through the inhibition of actin stress fiber formation in fibroblasts [32]. RND has multiple regulatory functions in carcinogenesis [33], cardiovascular disease [34], preeclampsia [35], and neural development [36]. Its upregulation would likely increase myosin phosphatase activity, which enhances uterine relaxation during pregnancy [37].
Vitamin D is mainly synthesized in the skin and, to a lesser extent, is obtained from food sources. It is a key modulator of Ca and phosphorus regulation. Vitamin D is first transported to the liver, where it is converted to 25-hydroxyvitamin D (25(OH)D3) in the liver mitochondria. It is further metabolized to the active form of vitamin D, 1,25-dihydroxyvitamin D (1,25(OH)2D3), in a process that occurs mainly in the kidneys [38]. The human endometrium expresses CYP24A1 either constitutively [39] or after stimulation with 1,25(OH)2D3 [40]. Thus, vitamin D3 signaling may participate in the normal functioning of the uterus and placenta during the pre- and post-implantation periods.
Monoamine oxidases are key regulatory molecules in monoamine neurotransmitter metabolic pathways and include the MAOA and monoamine oxidase B (MAOB) isoenzymes, which differ in their substrate selectivity and inhibitor sensitivity. Both MAOA and MAOB are located on the X chromosome but encode different proteins [41]. In recent years, investigators have suggested that MAOA may play an important role in promoting tumor migration and invasion, epithelial cell proliferation, and epithelial-mesenchymal transition [42]. Although these data suggest that the role of MAOA is not limited to the nervous system, its contribution to endometrial receptivity remains unclear. In a previous study of genes at different phases of the endometrial cycle, which included an analysis of published DNA sequencing ChIP data, MAOA was found to be highly expressed in the MS phase endometrium, compared to the ES phase endometrium, whereas the expression of MAOB did not change significantly between the two phases [4]. These microarray results suggested that MAOA may be involved in the establishment of endometrial receptivity. Previous experimental results have also revealed that deficient MAOA expression in the endometrium is associated with implantation failure in recipients of donated oocytes [43]. In women with adenomyosis and in an adenomyotic mouse model, reduced MAOA activity impaired endometrial receptivity by promoting inappropriate proliferation of endometrial epithelial cells via downregulation of the forkhead box protein O1 during the WOI [44]. In contrast, our results showed that MAOA was upregulated in the MS phase (compared with the ES phase) only in the non-pregnant group.
ADAMTS is a metalloproteinase family of secreted zinc-dependent proteases composed of 19 genetically distinct members in humans [45]. Most ADAMTS subtypes play a critical role in the remodeling of the extracellular matrix, and their expression is related to prenatal and postnatal growth as well as the development of several diseases, including cancer, arthritis, Alzheimer’s disease, and a number of inflammatory and thrombotic conditions [45-47]. Due to the ability of some ADAMTS proteins to cleave large chondroitin sulfates, subtypes 1, 4, 5, 8, 9, and 15 have been classified as aggrecanases [46]. The expression and function of aggrecanases in steroid-mediated extracellular matrix remodeling of the endometrium remain poorly characterized; however, it has been suggested that gonadocorticoids exhibit complicated regulatory activities on the expression of aggrecanases in primary cultures of human endometrial stromal cells. ADAMTS subtypes may play crucial roles in endometrial physiology [48].
HAP1, the first protein shown to interact with the huntingtin protein, is specifically expressed in human brain tissue and is involved in the pathogenesis of Huntington’s disease [49]. HAP1 is also found in the pituitary gland, thyroid gland, adrenal medulla, pancreatic islets, and other endocrine organs and tissues [50]. A previous study showed that HAP1 is involved in vesicular transport [51]. Therefore, HAP1 may regulate macromolecule secretion in the secretory endometrium. However, it was previously reported that HAP1 mRNA expression in the endometrium on menstrual cycle day 21 did not differ between patients with idiopathic infertility and fertile control patients [52].
Our study has several limitations. First, the sample size was relatively small. Therefore, our results should be considered preliminary and further large-scale studies are warranted. Secondly, because endometrial tissue samples were obtained from the menstrual cycle before IVF-ET, and not the actual IVF-ET attempt cycle, they may not reflect changes in an actual pregnancy cycle. However, it is not ethically possible to retrieve endometrial tissue during an IVF-ET attempt cycle because the sampling process may be detrimental to pregnancy outcomes. In addition, ovarian stimulation may affect endometrial receptivity compared to a natural cycle, suggesting that this may be due to supraphysiological concentrations of steroids during controlled ovarian stimulation [53]. Several studies have investigated the effects of different stimulation cycles on the endometrial receptivity transcriptomics. In previous studies that focused on the secretory phase, it was generally observed that while the expression patterns in the pre-receptive phase were similar between natural and stimulated cycles, notable differences were found when comparing WOI [54-57]. Therefore, further studies are necessary to evaluate endometrial transcriptomic patterns in natural menstrual cycles or hormone therapy cycles before frozen-thawed embryo transfer cycles, and to compare differences in DEGs according to embryo transfer outcomes. Nonetheless, the DEGs identified in the present study may be different from those in the subsequent IVF-ET cycle, and we believe that these novel DEGs may play a role in endometrial receptivity. Third, embryonic effects on implantation may have been unaccounted for. Although only patients with morphologically high-quality embryos(s) were included in our study, we did not screen for chromosomal abnormalities that may have affected pregnancy outcomes. Therefore, further investigations using euploid embryos are required. Fourth, we included endometrial samples obtained in the ES (days 16-18 of the menstrual cycle) or MS (days 19-21 of the menstrual cycle) phases. Considering that the endometrium changes rapidly around the time of implantation, the inclusion of samples collected on different menstrual cycle days could introduce significant variance in the results.
In conclusion, changes in endometrial transcriptomic patterns from the ES phase to the MS phase in a natural menstrual cycle immediately before IVF-ET appear to differ according to pregnancy outcomes. These novel DEGs, which have not been previously studied, may have functional significance during WOI and serve as potential biomarkers of endometrial receptivity.

Notes

Conflict of interest

No potential conflict of interest relevant to this article was reported.

Ethical approval

This study was approved by the Institutional Review Board of Severance Hospital (IRB No. 4-2018-0747), performed in accordance with the principles of the Declaration of Helsinki.

Patient consent

Informed consent was obtained from all participants in the study.

Funding information

This study was financially supported by a National Research Foundation of Korea (NRF) grant funded by the Korean government (MSIT) (2022R1A2C2008378), Faculty Research Grants of Yonsei University College of Medicine (6-2017-0189), and the Korea Health Technology R&D Project through the Korea Health Industry Development Institute funded by the Ministry of Health & Welfare, Republic of Korea (HI18C2047).

Fig. 1
Heatmaps of normalized gene expression data generated by the NanoString nSolver software via unsupervised clustering in the (A) pregnant group and (B) non-pregnant group. The heatmaps are scaled to give all genes equal variance. Within the gene clusters, red indicates high expression and green indicates low expression. The red rectangles indicate genes differentially expressed in the mid-secretory phase endometrium, compared with the early secretory phase endometrium, within each patient group. PLK2, polo like kinase 2; GPD1L, glycerol-3-phosphate dehydrogenase 1 like; FCGR3B, Fc gamma receptor IIIb; SERPINE1, serpin family E member 1; GLB1L2, galactosidase beta 1 like 2; ADRA2A, adrenoceptor alpha 2A; TMEM252, transmembrane protein 252; ITGA2, integrin subunit alpha 2; HAP1, huntingtin associated protein 1; LAMA2, laminin sub¬unit alpha 2; SMAD7, SMAD family member 7; MASP1, MBL associated serine protease 1; SPTLC3, serine palmitoyltransferase long chain base subunit 3; CILP, cartilage intermediate layer protein; C200f27, chromosome 20 open reading frame 27; ADAMTS8, a disintegrin and metalloproteinase with thrombospondin type 1 motifs, 8; SLC2A8, solute carrier family 2 member 8; APCDD1, adenomatosis polyposis coli down-regulated 1; TMEM37, transmembrane protein 37; ADAMTS15, a disintegrin and metal¬loproteinase with thrombospondin type 1 motifs, 15; 2CD4A, C2 calcium dependent domain containing 4A; MAOA, monoamine oxidase A; VNN3, vanin 3; KCNJ15, potassium inwardly rectifying channel subfamily J member 15; TNS4, tensin 4; TGM5, transglutaminase 5; FCAR, Fc fragment of IgA receptor; CEACAM3, carcinoembryonic antigen-related cell adhesion molecule 3; TFAP2A, transcription factor AP-2 alpha; ITGB3, integrin subunit beta 3; RND3, Rho family GTPase 3; CYP24A1, cytochrome P450 family 24 subfamily A member 1; IRAK2, interleukin 1 receptor associated kinase 2; NRG1, neuregulin 1; FPR1, formyl peptide receptor 1; SELL, selectin L; IL7R, interleukin 7 receptor; MMP25, matrix metallopeptidase 25; CCRL2, C-C motif chemokine receptor like 2; ADGRE3, adhesion G protein-coupled receptor E3; TSC22D1, transforming growth factor-beta-stimulated clone 22 domain family member 1; NRIP3, nuclear receptor interacting protein 3; OLR1, oxidized low density lipoprotein receptor 1; SLC11A1, solute carrier family 11 member 1; C2CD4A, C2 calcium dependent domain containing 4A; GPDIL, glycerol-3-phosphate dehydrogenase 1 like; ITGB6, integrin subunit beta 6.
ogs-22315f1.jpg
Fig. 2
Volcano plots of genes differentially expressed between the early secretory phase and mid-secretory phase endometrium in the (A) pregnant group and (B) non-pregnant group. Log2 fold-change differences between the early and mid-secretory endometria are shown on the X-axis, and negative log of P-values are shown on the Y-axis. Each point represents 1 gene with detectable expression in both phases. Genes with significant differential expression between the early secretory and mid-secretory endometria (with both a P-value <0.05 and fold-change ≥2) are plotted in red. Genes that did not exhibit significant differential expression between the two phases are shown in gray. ADRA2A, adrenoceptor alpha 2A; IRAK2, interleukin 1 receptor-associated kinase 2; TMEM37, transmembrane protein 37; AD¬AMTS15, a disintegrin and metalloproteinase with thrombospondin type 1 motifs, 15; GLB1L2, galactosidase beta 1 like 2; SERPINE1, serpin family E member 1; ITGB3, integrin subunit beta 3; TMEM252, transmembrane protein 252; RND3, Rho family GTPase 3; HAP1, huntingtin associated protein 1; ITGA2, integrin subunit alpha 2; ADAMTS8, a disintegrin and metalloproteinase with thrombospondin type 1 motifs, 8; MAOA, monoamine oxidase A; C2CD4A, C2 calcium dependent domain containing 4A.
ogs-22315f2.jpg
Table 1
Patient characteristics
Pregnant group (n=14) Non-pregnant group (n=16) P-value
Age (yr) 33.57±3.52 33.38±2.68 0.790
Previous pregnancy 0.886
 Yes 2 (14.3) 2 (12.5)
 No 12 (85.7) 14 (87.5)
Duration of infertility (yr) 6.00±3.29 5.17±3.56 0.538
Number of previous IVF attempts 4.57±3.39 4.19±1.90 0.759
Cause of infertility 0.663
 Tubal 2 (14.3) 1 (6.3)
 Male 5 (35.7) 5 (31.3)
 Unexplained 7 (50.0) 10 (62.5)

Values are presented as mean±standard deviation or number (%).

IVF, in vitro fertilization.

Table 2
Differentially expressed genes in mid-secretory phase endometrium, compared to early secretory phase endometrium, in the pregnant group
Gene name Fold change Statusa) P-value Gene description
ADRA2A 5.15 Up 8.55×10⁻⁶ Adrenoceptor alpha 2A (source: HGNC symbol; acc: HGNC: 281)
IRAK2 6.54 Up 1.45×10⁻⁶ Interleukin 1 receptor-associated kinase 2 (source: HGNC symbol; acc: HGNC: 6,113)
TMEM37 2.55 Up 0.000748 Transmembrane protein 37 (source: HGNC symbol; acc: HGNC: 18,216)
ADAMTS15 2.81 Up 0.00119 ADAM metallopeptidase with thrombospondin type 1 motif 15 (source: HGNC symbol; acc: HGNC: 16,305)
GLB1L2 3.47 Up 0.00124 Galactosidase beta 1 like 2 (source: HGNC symbol; acc: HGNC: 25,129)
SERPINE1 2.86 Up 0.00173 Serpin family E member 1 (source: HGNC symbol; acc: HGNC: 8,583)
ITGB3 3.69 Up 0.00222 Integrin subunit beta 3 (source: HGNC symbol; acc: HGNC: 6,156)
TMEM252 3.85 Up 0.00358 Transmembrane protein 252 (source: HGNC symbol; acc: HGNC: 28,537)
RND3 2.53 Up 0.00901 Rho family GTPase 3 (source: HGNC symbol; acc: HGNC: 671)
HAP1 3.77 Up 0.0111 Huntingtin-associated protein 1 (source: HGNC symbol; acc: HGNC: 4,812)
CYP24A1 3.41 Up 0.0195 Cytochrome P450 family 24 subfamily A member 1 (source: HGNC symbol; acc: HGNC: 2,602)
C2CD4A 3.33 Up 0.0227 C2 calcium-dependent domain containing 4A (source: HGNC symbol; acc: HGNC: 33,627)
ITGA2 2.58 Up 0.0249 Integrin subunit alpha 2 (source: HGNC symbol; acc: HGNC: 6,137)

ADRA2A, adrenoceptor alpha 2A; HGNC, HUGO Gene Nomenclature Committee; IRAK2, interleukin 1 receptor-associated kinase 2; TMEM37, transmembrane protein 37; ADAMTS15, a disintegrin and metalloproteinase with thrombospondin type 1 motifs, 15; GLB1L2, galactosidase beta 1 like 2; SERPINE1, serpin family E member 1; ITGB3, integrin subunit beta 3; TMEM252, transmembrane protein 252; RND3, Rho family GTPase 3; HAP1, huntingtin associated protein 1; CYP24A1, cytochrome P450 family 24 subfamily A member 1; C2CD4A, C2 calcium dependent domain containing 4A; ITGA2, integrin subunit alpha 2.

a) Upregulated (up) or downregulated (down) in the mid-secretory phase compared to the early secretory phase.

Table 3
Differentially expressed genes in mid-secretory phase endometrium, compared to early secretory phase endometrium, in the non-pregnant group
Gene name Fold change Statusa) P-value Gene description
ITGA2 2.84 Up 2.96×10⁻⁷ Integrin subunit alpha 2 (source: HGNC symbol; acc: HGNC: 6,137)
ADAMTS8 −2.82 Down 5.69×10⁻⁶ ADAM metallopeptidase with thrombospondin type 1 motif 8 (source: HGNC symbol; acc: HGNC: 224)
MAOA 4.36 Up 1.63×10⁻⁵ Monoamine oxidase A (source: HGNC symbol; acc: HGNC: 6,833)
C2CD4A 6.29 Up 8.41×10⁻⁵ C2 calcium-dependent domain containing 4A (source: HGNC symbol; acc: HGNC: 33,627)
ADRA2A 4.34 Up 0.000375 Adrenoceptor alpha 2A (source: HGNC symbol; acc: HGNC: 281)
IRAK2 3.37 Up 0.00113 Interleukin 1 receptor-associated kinase 2 (source: HGNC symbol; acc: HGNC: 6,113)
ITGB3 2.90 Up 0.00326 Integrin subunit beta 3 (source: HGNC symbol; acc: HGNC: 6,156)
ADAMTS15 2.08 Up 0.0112 ADAM metallopeptidase with thrombospondin type 1 motif 15 (source: HGNC symbol; acc: HGNC: 16,305)
TMEM252 4.08 Up 0.0123 Transmembrane protein 252 (source: HGNC symbol; acc: HGNC: 28,537)
SERPINE1 2.07 Up 0.0124 Serpin family E member 1 (source: HGNC symbol; acc: HGNC: 8,583)
HAP1 2.94 Up 0.0155 Huntingtin associated protein 1 (source: HGNC symbol; acc: HGNC: 4,812)

ITGA2, integrin subunit alpha 2; HGNC, HUGO Gene Nomenclature Committee; ADAMTS8, a disintegrin and metalloproteinase with thrombospondin type 1 motifs, 8; MAOA, monoamine oxidase A; C2CD4A, C2 calcium dependent domain containing 4A; ADRA2A, adrenoceptor alpha 2A; IRAK2, interleukin 1 receptor associated kinase 2; ITGB3, integrin subunit beta 3; ADAMTS15, a disintegrin and metalloproteinase with thrombospondin type 1 motifs, 15; TMEM252, transmembrane protein 252; SERPINE1, serpin family E member 1; HAP1, huntingtin associated protein 1.

a) Upregulated (up) or downregulated (down) in the mid-secretory phase compared to the early secretory phase.

Table 4
Molecular functions, biologic processes, and KEGG pathways of genes with differences in differentially expressed genes between the pregnant and non-pregnant groups
Gene name Molecular function Biologic process KEGG pathway
Up-regulated only in the pregnant group
 TMEM37 Voltage-gated ion channel activity, calcium channel activity Lon transmembrane transport, calcium ion transmembrane transport
 GLB1L2 Hydrolase activity, hydrolyzing O-glycosyl compounds, beta-galactosidase activity, hydrolase activity, acts on glycosyl bonds Carbohydrate metabolic processes
 RND3 GTPase activity, GTP binding Small GTPase-mediated signal transduction
 CYP24A1 Heme binding, oxidoreductase activity, iron ion binding, monooxygenase activity, oxidoreductase activity, metal ion binding, CYP24A1 activity, CYP24 activity Response to vitamin D, vitamin D metabolic process, vitamin D catabolic process, osteoblast differentiation Metabolic pathways; steroid biosynthesis; parathyroid hormone synthesis, secretion, and action; microRNAs in cancer
Up-regulated only in the non-pregnant group
 MAOA Copper ion binding, metal ion binding, oxidoreductase activity, monoamine oxidase activity, aliphatic amine oxidase activity; phenethylamine: oxygen oxidoreductase (deaminating) activity; primary amine oxidase activity Amine metabolic process Metabolic pathways (glycine, serine, and threonine; arginine and proline; histidine; tyrosine; phenylalanine; tryptophan; drugs); dopaminergic synapses; serotonergic synapses; Parkinson disease
 HAP1 GABAergic synapses, amyotrophic lateral sclerosis, Huntington’s disease, pathways of neurodegeneration
Downregulated only in the non-pregnant group
 ADAMTS8 Metalloendopeptidase activity, metallopeptidase activity, zinc ion binding, peptidase activity, metallopeptidase activity, hydrolase activity, metal ion binding Extracellular matrix organization, proteolysis

KEGG, Kyoto encyclopedia of genes and genomes; TMEM37, transmembrane protein 37; GLB1L2, galactosidase beta 1 like 2; RND3, Rho family GTPase 3; GTP, guanosine diphosphate; CYP24A1, cytochrome P450 family 24 subfamily A member 1; RNA, ribonucleic acid; MAOA, monoamine oxidase A; HAP1, huntingtin associated protein 1; GABA, gamma-aminobutyric acid; ADAMTS8, a disintegrin and metalloproteinase with thrombospondin type 1 motifs, 8.

References

1. Norwitz ER, Schust DJ, Fisher SJ. Implantation and the survival of early pregnancy. N Engl J Med 2001;345:1400-8.
crossref pmid
2. Wilcox AJ, Baird DD, Weinberg CR. Time of implantation of the conceptus and loss of pregnancy. N Engl J Med 1999;340:1796-9.
crossref pmid
3. Noyes RW, Hertig AT, Rock J. Dating the endometrial biopsy. Am J Obstet Gynecol 1975;122:262-3.
crossref pmid
4. Talbi S, Hamilton AE, Vo KC, Tulac S, Overgaard MT, Dosiou C, et al. Molecular phenotyping of human endometrium distinguishes menstrual cycle phases and underlying biological processes in normo-ovulatory women. Endocrinology 2006;147:1097-121.
crossref pmid pdf
5. Edwards RG. Human uterine endocrinology and the implantation window. Ann N Y Acad Sci 1988;541:445-54.
crossref pmid
6. Harper MJ. The implantation window. Baillieres Clin Obstet Gynaecol 1992;6:351-71.
pmid
7. Coutifaris C, Myers ER, Guzick DS, Diamond MP, Carson SA, Legro RS, et al. Histological dating of timed endometrial biopsy tissue is not related to fertility status. Fertil Steril 2004;82:1264-72.
crossref pmid
8. Haouzi D, Mahmoud K, Fourar M, Bendhaou K, Dechaud H, De Vos J, et al. Identification of new biomarkers of human endometrial receptivity in the natural cycle. Hum Reprod 2009;24:198-205.
crossref pmid
9. Achache H, Revel A. Endometrial receptivity markers, the journey to successful embryo implantation. Hum Reprod Update 2006;12:731-46.
crossref pmid
10. Wang W, Vilella F, Alama P, Moreno I, Mignardi M, Isakova A, et al. Single-cell transcriptomic atlas of the human endometrium during the menstrual cycle. Nat Med 2020;26:1644-53.
crossref pmid pdf
11. Craciunas L, Gallos I, Chu J, Bourne T, Quenby S, Brosens JJ, et al. Conventional and modern markers of endometrial receptivity: a systematic review and meta-analysis. Hum Reprod Update 2019;25:202-23.
crossref pmid
12. Díaz-Gimeno P, Ruiz-Alonso M, Blesa D, Bosch N, Martínez-Conejero JA, Alamá P, et al. The accuracy and reproducibility of the endometrial receptivity array is superior to histology as a diagnostic method for endometrial receptivity. Fertil Steril 2013;99:508-17.
crossref pmid
13. Díaz-Gimeno P, Horcajadas JA, Martínez-Conejero JA, Esteban FJ, Alamá P, Pellicer A, et al. A genomic diagnostic tool for human endometrial receptivity based on the transcriptomic signature. Fertil Steril 2011;95:50-60e1. -15.
crossref pmid
14. Patel JA, Patel AJ, Banker JM, Shah SI, Banker MR. Personalized embryo transfer helps in improving in vitro fertilization/ICSI outcomes in patients with recurrent implantation failure. J Hum Reprod Sci 2019;12:59-66.
crossref pmid pmc
15. Tan J, Kan A, Hitkari J, Taylor B, Tallon N, Warraich G, et al. The role of the endometrial receptivity array (ERA) in patients who have failed euploid embryo transfers. J Assist Reprod Genet 2018;35:683-92.
crossref pmid pmc pdf
16. Cozzolino M, Diaz-Gimeno P, Pellicer A, Garrido N. Evaluation of the endometrial receptivity assay and the preimplantation genetic test for aneuploidy in overcoming recurrent implantation failure. J Assist Reprod Genet 2020;37:2989-97.
crossref pmid pmc pdf
17. Eisman LE, Pisarska MD, Wertheimer S, Chan JL, Akopians AL, Surrey MW, et al. Clinical utility of the endometrial receptivity analysis in women with prior failed transfers. J Assist Reprod Genet 2021;38:645-50.
crossref pmid pmc pdf
18. Saxtorph MH, Hallager T, Persson G, Petersen KB, Eriksen JO, Larsen LG, et al. Assessing endometrial receptivity after recurrent implantation failure: a prospective controlled cohort study. Reprod Biomed Online 2020;41:998-1006.
crossref pmid
19. Simón C, Gómez C, Cabanillas S, Vladimirov I, Castillón G, Giles J, et al. A 5-year multicentre randomized controlled trial comparing personalized, frozen and fresh blastocyst transfer in IVF. Reprod Biomed Online 2020;41:402-15.
crossref pmid
20. Raff M, Jacobs E, Voorhis BV. End of an endometrial receptivity array? Fertil Steril 2022;118:737.
crossref pmid
21. Sebastian-Leon P, Garrido N, Remohí J, Pellicer A, Diaz-Gimeno P. Asynchronous and pathological windows of implantation: two causes of recurrent implantation failure. Hum Reprod 2018;33:626-35.
crossref pmid
22. Mirkin S, Arslan M, Churikov D, Corica A, Diaz JI, Williams S, et al. In search of candidate genes critically expressed in the human endometrium during the window of implantation. Hum Reprod 2005;20:2104-17.
crossref pmid
23. Hu S, Yao G, Wang Y, Xu H, Ji X, He Y, et al. Transcriptomic changes during the pre-receptive to receptive transition in human endometrium detected by RNA-Seq. J Clin Endocrinol Metab 2014;99:E2744-53.
crossref pmid
24. R Riesewijk A, Martín J, van Os R, Horcajadas JA, Polman J, Pellicer A, et al. Gene expression profiling of human endometrial receptivity on days LH+2 versus LH+7 by microarray technology. Mol Hum Reprod 2003;9:253-64.
crossref pmid
25. Carson DD, Lagow E, Thathiah A, Al-Shami R, Farach-Carson MC, Vernon M, et al. Changes in gene expression during the early to mid-luteal (receptive phase) transition in human endometrium detected by high-density microarray screening. Mol Hum Reprod 2002;8:871-9.
crossref pmid
26. Vandesompele J, De Preter K, Pattyn F, Poppe B, Van Roy N, De Paepe A, et al. Accurate normalization of real-time quantitative RT-PCR data by geometric averaging of multiple internal control genes. Genome Biol 2002;3:RESEARCH0034.
crossref pmid pmc pdf
27. Reimand J, Arak T, Adler P, Kolberg L, Reisberg S, Peterson H, et al. g:Profiler-a web server for functional interpretation of gene lists (2016 update). Nucleic Acids Res 2016;44:W83-9.
crossref pmid pmc
28. Yu G, Wang LG, Han Y, He QY. clusterProfiler: an R package for comparing biological themes among gene clusters. OMICS 2012;16:284-7.
crossref pmid pmc
29. Solimena M, Schulte AM, Marselli L, Ehehalt F, Richter D, Kleeberg M, et al. Systems biology of the IMIDIA biobank from organ donors and pancreatectomised patients defines a novel transcriptomic signature of islets from individuals with type 2 diabetes. Diabetologia 2018;61:641-57.
crossref pmid pmc pdf
30. Li C, Shen Z, Zhou Y, Yu W. Independent prognostic genes and mechanism investigation for colon cancer. Biol Res 2018;51:10.
crossref pmid pmc pdf
31. Gaudet P, Livstone MS, Lewis SE, Thomas PD. Phylogenetic-based propagation of functional annotations within the Gene Ontology consortium. Brief Bioinform 2011;12:449-62.
crossref pmid pmc
32. Nobes CD, Lauritzen I, Mattei MG, Paris S, Hall A, Chardin P. A new member of the Rho family, Rnd1, promotes disassembly of actin filament structures and loss of cell adhesion. J Cell Biol 1998;141:187-97.
crossref pmid pmc pdf
33. Liu B, Lin X, Yang X, Dong H, Yue X, Andrade KC, et al. Downregulation of RND3/RhoE in glioblastoma patients promotes tumorigenesis through augmentation of notch transcriptional complex activity. Cancer Med 2015;4:1404-16.
crossref pmid pmc pdf
34. Dai Y, Song J, Li W, Yang T, Yue X, Lin X, et al. RhoE fine-tunes inflammatory response in myocardial infarction. Circulation 2019;139:1185-98.
crossref pmid pmc
35. Huang L, Ma Y, Chen L, Chang J, Zhong M, Wang Z, et al. Maternal RND3/RhoE deficiency impairs placental mitochondrial function in preeclampsia by modulating the PPARγ-UCP2 cascade. FASEB J 2021;35:e21555.
crossref pmid pdf
36. Lin X, Liu B, Yang X, Yue X, Diao L, Wang J, et al. Genetic deletion of Rnd3 results in aqueductal stenosis leading to hydrocephalus through up-regulation of Notch signaling. Proc Natl Acad Sci U S A 2013;110:8236-41.
crossref pmid pmc
37. Lartey J, Gampel A, Pawade J, Mellor H, Bernal AL. Expression of RND proteins in human myometrium. Biol Reprod 2006;75:452-61.
pmid
38. Ji JL, Muyayalo KP, Zhang YH, Hu XH, Liao AH. Immunological function of vitamin D during human pregnancy. Am J Reprod Immunol 2017;78:e12716.
crossref pdf
39. Agic A, Xu H, Altgassen C, Noack F, Wolfler MM, Diedrich K, et al. Relative expression of 1,25-dihydroxyvitamin D3 receptor, vitamin D 1 alpha-hydroxylase, vitamin D 24-hydroxylase, and vitamin D 25-hydroxylase in endometriosis and gynecologic cancers. Reprod Sci 2007;14:486-97.
crossref pmid pdf
40. Viganò P, Lattuada D, Mangioni S, Ermellino L, Vignali M, Caporizzo E, et al. Cycling and early pregnant endometrium as a site of regulated expression of the vitamin D system. J Mol Endocrinol 2006;36:415-24.
crossref pmid
41. Lan NC, Heinzmann C, Gal A, Klisak I, Orth U, Lai E, et al. Human monoamine oxidase A and B genes map to Xp 11.23 and are deleted in a patient with Norrie disease. Genomics 1989;4:552-9.
crossref pmid
42. Wu JB, Yin L, Shi C, Li Q, Duan P, Huang JM, et al. MAOA-dependent activation of Shh-IL6-RANKL signaling network promotes prostate cancer metastasis by engaging tumor-stromal cell interactions. Cancer Cell 2017;31:368-82.
crossref pmid
43. Henriquez S, Tapia A, Quezada M, Vargas M, Cardenas H, Rios M, et al. Deficient expression of monoamine oxidase A in the endometrium is associated with implantation failure in women participating as recipients in oocyte donation. Mol Hum Reprod 2006;12:749-54.
crossref pmid
44. Tian J, Zhang C, Kang N, Wang J, Kong N, Zhou J, et al. Attenuated monoamine oxidase a impairs endometrial receptivity in women with adenomyosis via downregulation of FOXO1. Biol Reprod 2021;105:1443-57.
crossref pmid pdf
45. Porter S, Clark IM, Kevorkian L, Edwards DR. The ADAMTS metalloproteinases. Biochem J 2005;386:15-27.
crossref pmid pmc pdf
46. Apte SS. A disintegrin-like and metalloprotease (reprolysin type) with thrombospondin type 1 motifs: the ADAMTS family. Int J Biochem Cell Biol 2004;36:981-5.
crossref pmid
47. Wagstaff L, Kelwick R, Decock J, Edwards DR. The roles of ADAMTS metalloproteinases in tumorigenesis and metastasis. Front Biosci (Landmark Ed) 2011;16:1861-72.
crossref pmid
48. Wen J, Zhu H, Leung PC. Gonadal steroids regulate the expression of aggrecanases in human endometrial stromal cells in vitro. J Cell Mol Med 2013;17:1325-34.
crossref pmid pmc pdf
49. Wu LL, Zhou XF. Huntingtin associated protein 1 and its functions. Cell Adh Migr 2009;3:71-6.
crossref pmid pmc
50. Zhao X, Chen A, Wang Z, Xu XH, Tao Y. Biological functions and potential therapeutic applications of huntingtin-associated protein 1: progress and prospects. Clin Transl Oncol 2022;24:203-14.
crossref pmid pdf
51. Li XJ, Li SH. HAP1 and intracellular trafficking. Trends Pharmacol Sci 2005;26:1-3.
crossref pmid
52. D’Aurora M, Romani F, Franchi S, Diomede F, Merciaro I, Impicciatore GG, et al. MRAP2 regulates endometrial receptivity and function. Gene 2019;703:7-12.
crossref pmid
53. Liu C, Li Y, Jiang H, Liu Y, Song X. The clinical outcomes of fresh versus frozen embryos transfer in women ≥40 years with poor ovarian response. Obstet Gynecol Sci 2021;64:284-92.
crossref pmid pmc pdf
54. Liu Y, Lee KF, Ng EH, Yeung WS, Ho PC. Gene expression profiling of human peri-implantation endometria between natural and stimulated cycles. Fertil Steril 2008;90:2152-64.
crossref pmid
55. Horcajadas JA, Riesewijk A, Polman J, van Os R, Pellicer A, Mosselman S, et al. Effect of controlled ovarian hyperstimulation in IVF on endometrial gene expression profiles. Mol Hum Reprod 2005;11:195-205.
crossref pmid
56. Horcajadas JA, Minguez P, Dopazo J, Esteban FJ, Dominguez F, Giudice LC, et al. Controlled ovarian stimulation induces a functional genomic delay of the endometrium with potential clinical implications. J Clin Endocrinol Metab 2008;93:4500-10.
crossref pmid pdf
57. Haouzi D, Assou S, Mahmoud K, Tondeur S, Reme T, Hedon B, et al. Gene expression profile of human endometrial receptivity: comparison between natural and stimulated cycles for the same patients. Hum Reprod 2009;24:1436-45.
crossref pmid pmc
TOOLS
Share :
Facebook Twitter Linked In Google+ Line it
METRICS Graph View
  • 0 Crossref
  •     Scopus
  • 1,641 View
  • 115 Download
Related articles in Obstet Gynecol Sci


ABOUT
ARTICLE & TOPICS
Article category

Browse all articles >

Topics

Browse all articles >

BROWSE ARTICLES
POLICY
FOR CONTRIBUTORS
Editorial Office
4th Floor, 36 Gangnam-daero 132-gil, Gangnam-gu, Seoul 06044, Korea.
Tel: +82-2-2266-7238    Fax: +82-2-3445-2440    E-mail: journal@ogscience.org                

Copyright © 2024 by Korean Society of Obstetrics and Gynecology.

Developed in M2PI

Close layer
prev next