Prevalence of malnourishment and predictive factors associated with the nutritional status of gynecologic cancer patients undergoing chemotherapy: a cross-sectional analysis
Article information

Abstract
Objective
To investigate the prevalence and predictive factors of malnourishment in patients with gynecologic cancer during chemotherapy.
Methods
A total of 101 patients treated with chemotherapy between April 2020 and February 2021 were interviewed using the patient-generated subjective global assessment (PG-SGA). Clinical and laboratory data were also collected. The total number of lymphocytes per cubic milliliter (total lymphocyte count, TLC) and serum albumin were calculated to provide an optimal cut-off point using receiver operating characteristic curves. Clinicopathological variables were compared using univariate and multivariate analyses to identify the independent predictive factors for malnourishment.
Results
The prevalence of good, moderate, and severe nourishment was 73.3%, 18.8%, and 7.9%, respectively. The optimal cut-off points for TLC and albumin were 1,450 cells/μL and for albumin was 3.9 g/dL. Univariate analysis indicated that the number of chemotherapy cycles ≤3, albumin level ≤3.95 g/dL, body mass index ≤25 kg/m2, TLC <1,450 cells/μL, anemia, and no neutropenia were significantly associated with malnutrition. However, only a serum albumin level ≤3.95 g/dL was independently associated with malnourishment.
Conclusion
Patients with gynecologic cancer treated with chemotherapy were occasionally found to be malnourished, with the independent predictive predictor being a blood albumin level less than or equal to 3.95 g/dL.
Introduction
In 2020, the world age-standardized incidence rate of gynecologic cancer, including cervical, uterine, and ovarian cancer, was 28.6 per 100,000 people, while the gynecologic cancer incidence rate in Thailand was 27.3 [1]. One of the main treatments for these cancers is chemotherapy, which can cause malnutrition due to drug toxicity, which causes detrimental conditions, including gastrointestinal mucositis, mouth ulcerations, secondary hemorrhage, diarrhea, dysgeusia, and nausea. In addition, malnutrition might develop from local tumor growth, which increases the production of inflammatory response substances such as interleukin-6, which play a major role in interfering with carbohydrate, fat, and protein metabolism, and also affects the central appetite control system, leading to the development of anorexia, food intolerance, vomiting, hypoalbuminemia, and anemia [2]. In addition, progressive malnutrition is the cause of increased chemotherapy toxicity through the following mechanisms: 1) increased infection by impaired gut-associated lymphatic tissue and systemic immune function; 2) impaired drug clearance by malfunction of pharmacokinetic and pharmacodynamic aspects of chemotherapy; and 3) deficit of micronutrients to protect non-tumor cells [3]. Therefore, malnutrition is associated with negative outcomes, including increased morbidity, an uneventful response, and decreased quality of life. The early detection of malnutrition and appropriate nutritional support may lead to beneficial outcomes.
Nutritional assessment is an important tool for evaluating this status. One of the most widely used tools for nutritional assessment is patient-generated subjective global assessment (PG-SGA). This tool is a valid and reliable method for assessing the nutritional status of cancer patients, with a sensitivity of 98% and specificity of 82% [4]. It is based on a combination of known prognostic indicators of weight loss and performance status, as well as the clinical aspects of dietary intake and its impediments [5,6]. Furthermore, many factors, such as performance status, body mass index (BMI), and some biochemical parameters, including total lymphocyte count (TLC) or albumin concentration, were found to be associated with nutritional status [7]. However, information concerning the nutritional status of gynecologic patients who were receiving chemotherapy was limited; therefore, we conducted this cross-sectional study to prove this hypothesis that chemotherapy, used to treat gynecologic cancer, affects the patients’ nutritional status and to identify the factors associated with nutritional changes in these patients.
This knowledge may be beneficial in providing appropriate nutritional therapy to minimize the serious consequences of malnutrition.
Materials and methods
1. Patient selection
This cross-sectional study was conducted between April 20, 2020, and February 28, 2021, with the following approval of the Local Research Committee. The inclusion criteria were primary and recurrent gynecologic cancer patients aged >18 years who received at least one cycle of chemotherapy, and the last cycle was within 8 weeks at Chiang Mai University Hospital. Patients who had received previous treatment with either concurrent chemoradiation or radiation only or had any underlying disease could participate in this study, while those with cognitive impairments or non-Thai-speaking patients were excluded.
All patients who met the inclusion criteria were invited to participate in an interview to complete the PG-SGA (Thai version) [8]. The assessment was conducted by a well-trained interviewer medical team, and the scores were summarized. The PG-SGA tool consists of two parts: 1) a check-box medical history component divided into four sections that are completed by the patients (weight history, nutrition impact symptoms, nutritional intake, and functional capacity) and 2) sections relating to diagnosis, age, metabolic stress, a physical examination (subcutaneous fat loss, muscle wasting, and fluid status), and a global assessment to be completed by the medical team. For each component of the PG-SGA, 0 to 4 points were awarded with reference to the relative effect on nutritional status. The scores range from 0 to 35, with a higher score reflecting greater nutritional risk, and scores of more than 9 indicating a critical need for nutritional or symptom management, or both. The 2 scores were then combined to classify the patients as well-nourished (SGA-A), moderately malnourished or suspected of being malnourished (SGA-B), or severely malnourished (SGA-C) [5]. SGA-B and SGA-C are classified as malnourished.
The following clinical data were collected: age, BMI, underlying disease (a medical condition or disease that interferes with daily life or activities and requires continuous medical attention or medical care), diagnosis, International Federation of Gynecology and Obstetrics (FIGO) staging, recurrence status, surgical intervention, European Cooperative Oncology Group (ECOG) performance status, details of chemotherapy, and Common Terminology Criteria for Adverse Events version 5.0. Blood parameter data collected included hematologic markers, total number of lymphocytes per cubic milliliter (TLC), and albumin level (g/dL), all collected within the 2-week period before the next cycle of chemotherapy. TLC was calculated as the percentage of lymphocytes multiplied by the total white blood cell count and divided by 100. A flowchart of the study is summarized in Fig. 1.
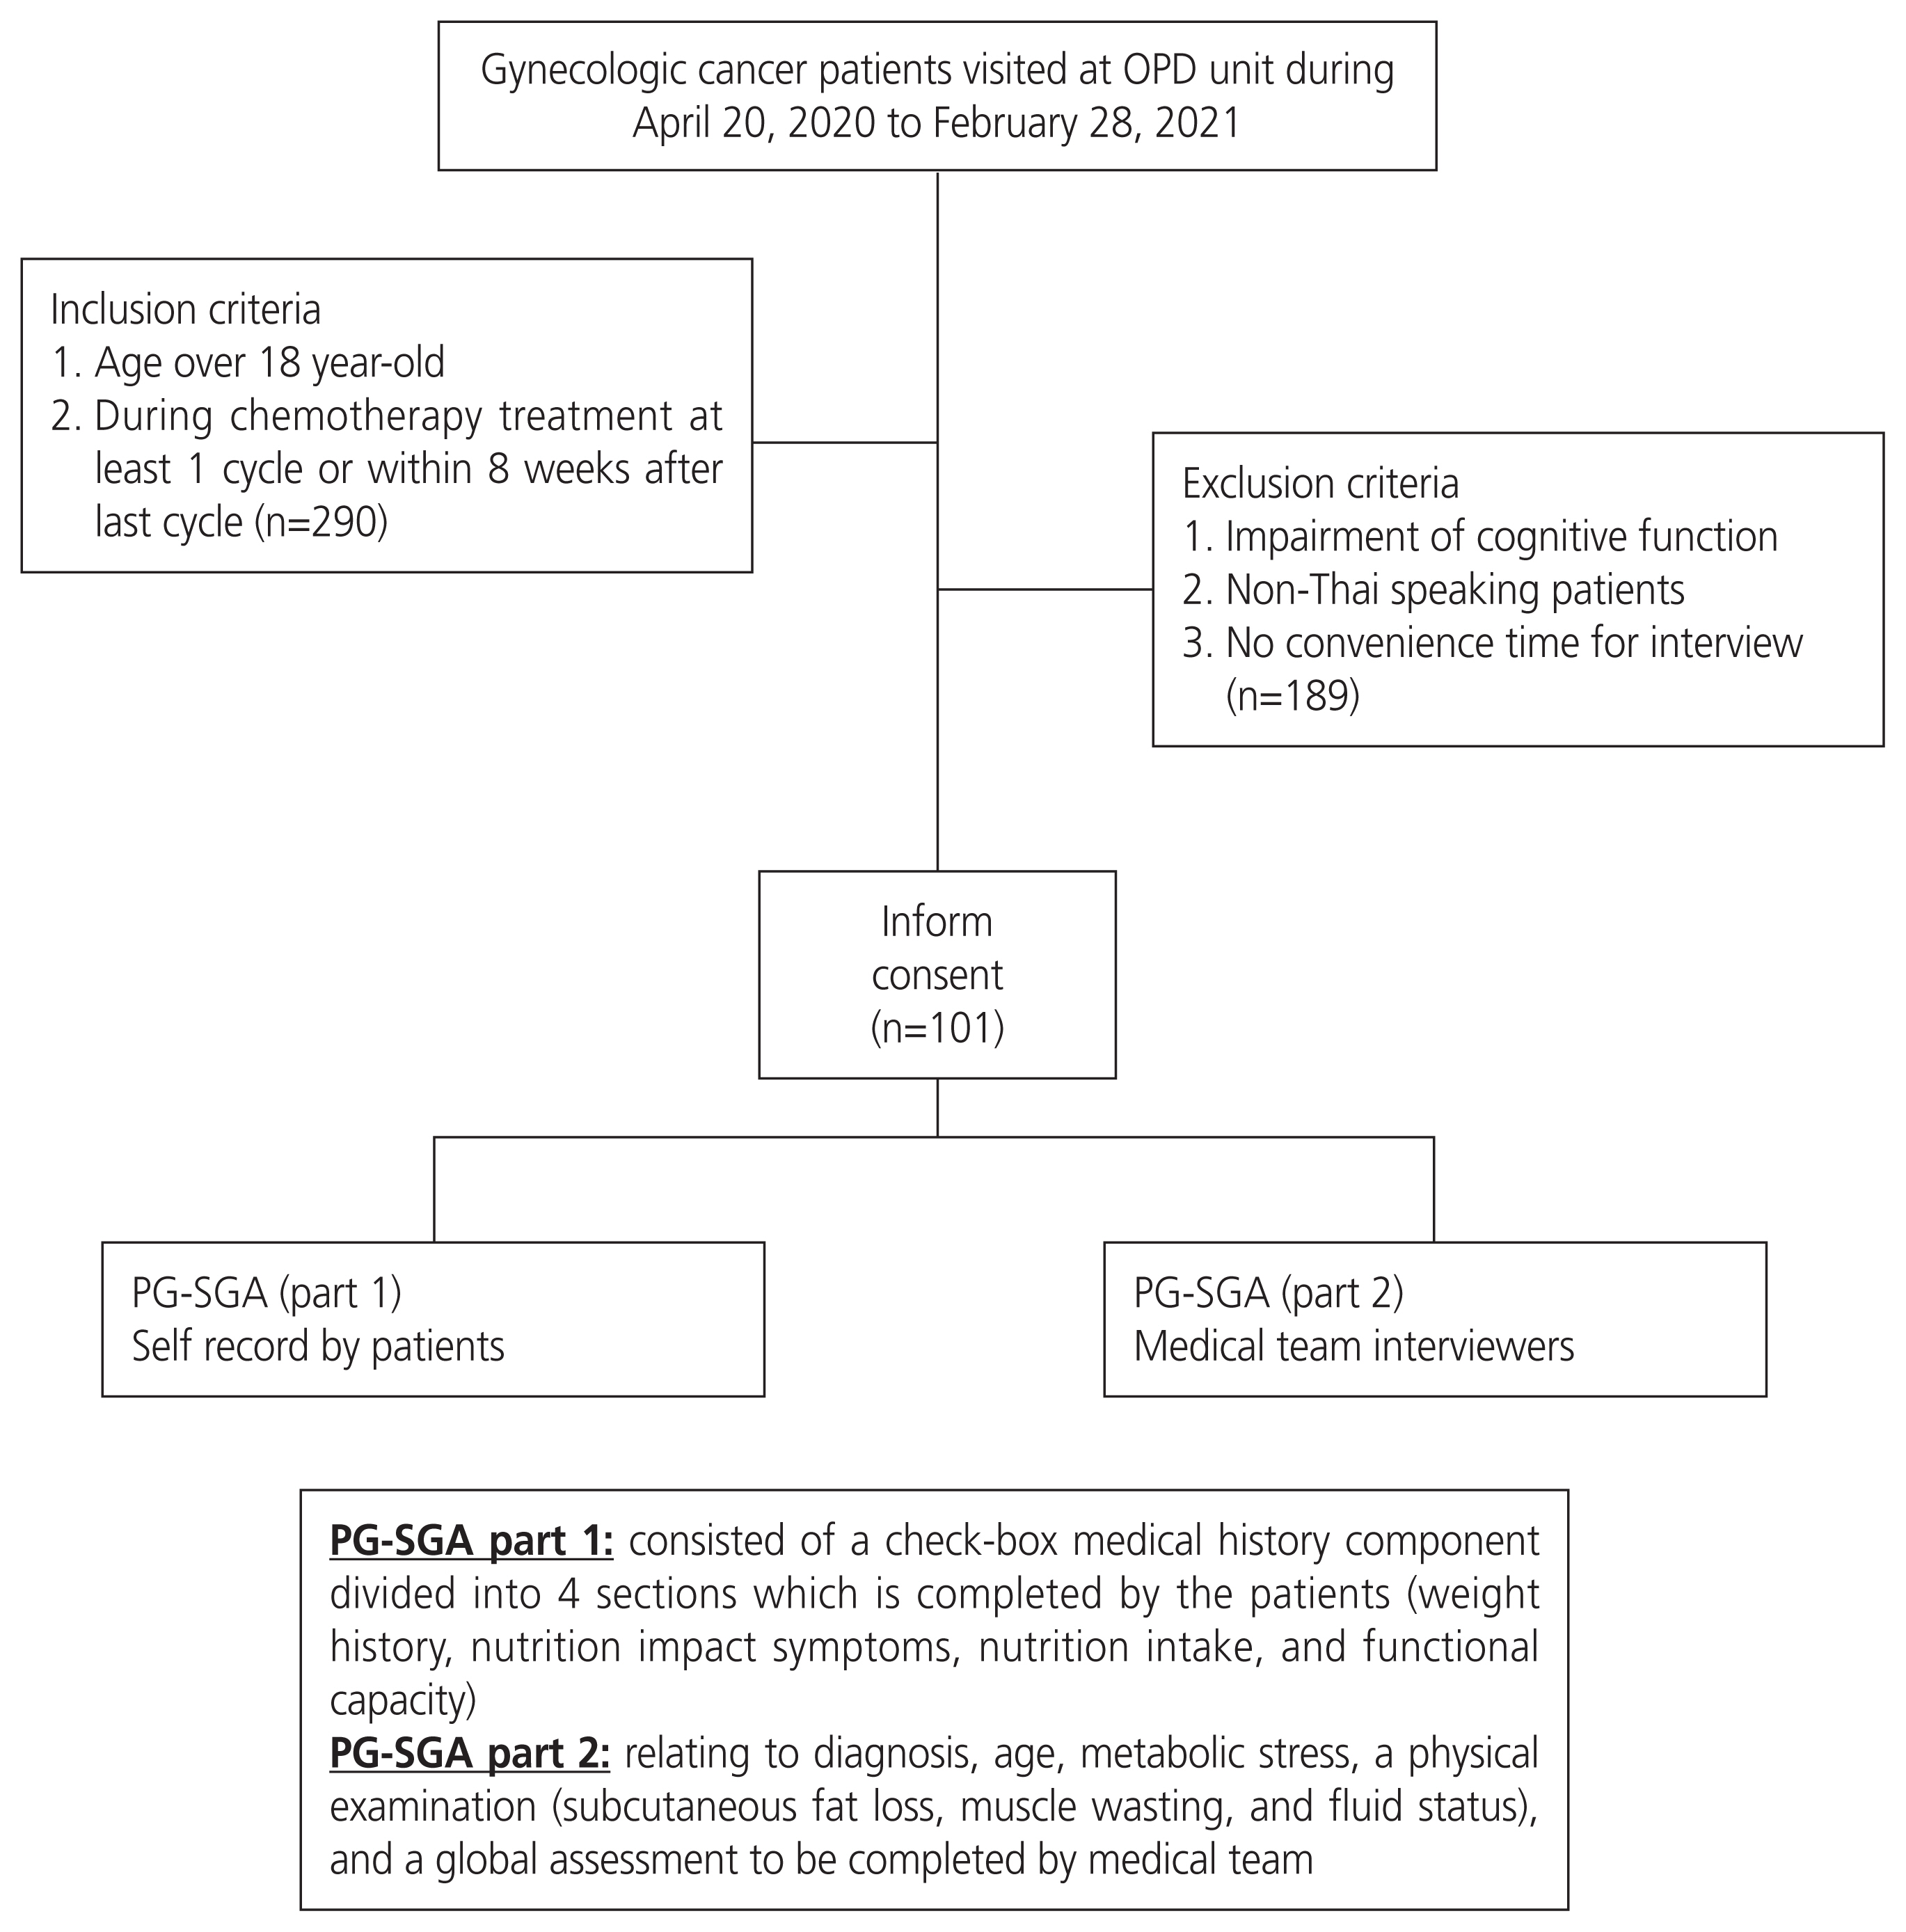
The flow chart of the study. OPD, out-patient department; PG-SGA, patient generated-subjective global assessment.
2. The sample size calculation
The sample size was calculated using the following formula [9]:
α = Level of significance = 0.05
where p represents the population of lung cancer patients who developed malnutrition during treatment with chemotherapy at 0.65 [10], while p0 was the reference value equal to 0.5, owing to unknown previous data. A minimum sample size of 88 patients is required. Reasons for referencing the lung cancer population include missing previous publications on the nutritional status of gynecologic cancer patients during chemotherapy, as well as similarities in chemotherapy regimens and the non-involvement of oral surgery or radiation.
3. Statistical analysis
Statistical analysis of the data was performed using IBM SPSS Statistics ver. 22.0 for Window program (IBM, Armonk, NY, USA). Chi-square or Fisher’s exact tests and t-tests were used for comparative analysis of the factors between the well-nourished and malnourished groups, to calculate the odds ratio of categorical variables, and for comparison between the clinical and blood parameter variables. A receiver operating characteristic curve (ROC) was used to assess the discriminative role of TLC and albumin levels, and the best cut-off value of each item was determined to further predict nutritional status. Binary logistic regression analysis with the backward likelihood ratio method was used to identify potential independent predictive factors for nutritional status. Statistical significance was set at P<0.05.
Results
A total of 290 patients met the inclusion criteria, but 101 provided consent to participate in this study. The remaining participants refused to participate in the study because of the lack of convenient time for the interview. The clinical data are presented in Table 1. The mean age of the participants was 54.6 years old, and 49.5% had no underlying disease. The most frequent diagnoses were ovarian and cervical cancer. Nearly half of the participants were newly diagnosed, and the majority were in advanced stages. Eighteen patients had previously received concurrent chemoradiation, and eight had previously received radiation alone. In addition, about 70% of the patients underwent surgery before receiving chemotherapy, and five patients underwent bowel surgery, with three of them retaining colostomy. Regarding chemotherapy, 63.4% of the patients were chemo-naive. Nearly 60% of patients were administered a carboplatin plus paclitaxel regimen every 3 to 4 weeks. The other regimens were as follows: cisplatin and paclitaxel (8), cisplatin and gemcitabine (3), carboplatin and pegylated liposomal doxorubicin PLD (3), cisplatin and etoposide (2), adriamycin and ifosfamide (2), carboplatin & 5-fluorouracil (1), cisplatin (2), PLD (2), ifosfamide (1), adriamycin (1), etoposide and methotrexate and actinomycin D and cyclophosphamide and vincristine (EMACO) (2), methotrexate and 5-fluorouracil (1), weekly paclitaxel (8), and weekly gemcitabine (7). All regimens were scheduled as every 3 to 4 weeks except EMACO and methotrexate + folinic acid, which were administered every 2 weeks, and weekly paclitaxel and gemcitabine were administered at 3 consecutive weeks every 28 days for 1 cycle. When basic clinical data were compared between the well-nourished and malnourished groups, it was observed that malnourishment was significantly associated with a low BMI, a high ECOG score, and a high grade of nausea, vomiting, and mucositis.

Basic clinical data (n=101)
Most of the patients were interviewed for the PG-SGA after receiving at least three cycles of chemotherapy, and 9.9% of the participants had received more than 20 chemotherapy cycles. Grade 2 and 3 nausea occurred in 24 and three patients, respectively, whereas grade 2 vomiting occurred in only three patients.
Concerning nutritional status, about 24% of the patients revealed PG-SGA scores equal to or more than nine, and the prevalence of well, moderate and severe malnourishment was 73.3%, 18.8%, and 7.9%, respectively, as shown in Table 2. Therefore, 26.7% of participants were malnourished. To identify the potential factors associated with malnutrition, ROC and the area under the curve for the optimum cut-off points of TLC and albumin were used, and the results showed that the most effective cut-off point of TLC was 1,450 cells/μL and albumin was 3.9 g/dL. as shown in Fig. 2. The mean values of TLC and albumin in the malnourished group were significantly lower than those in the wellnourished group (Table 3).
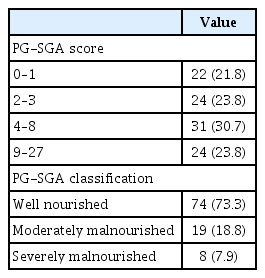
The PG-SGA score and classification
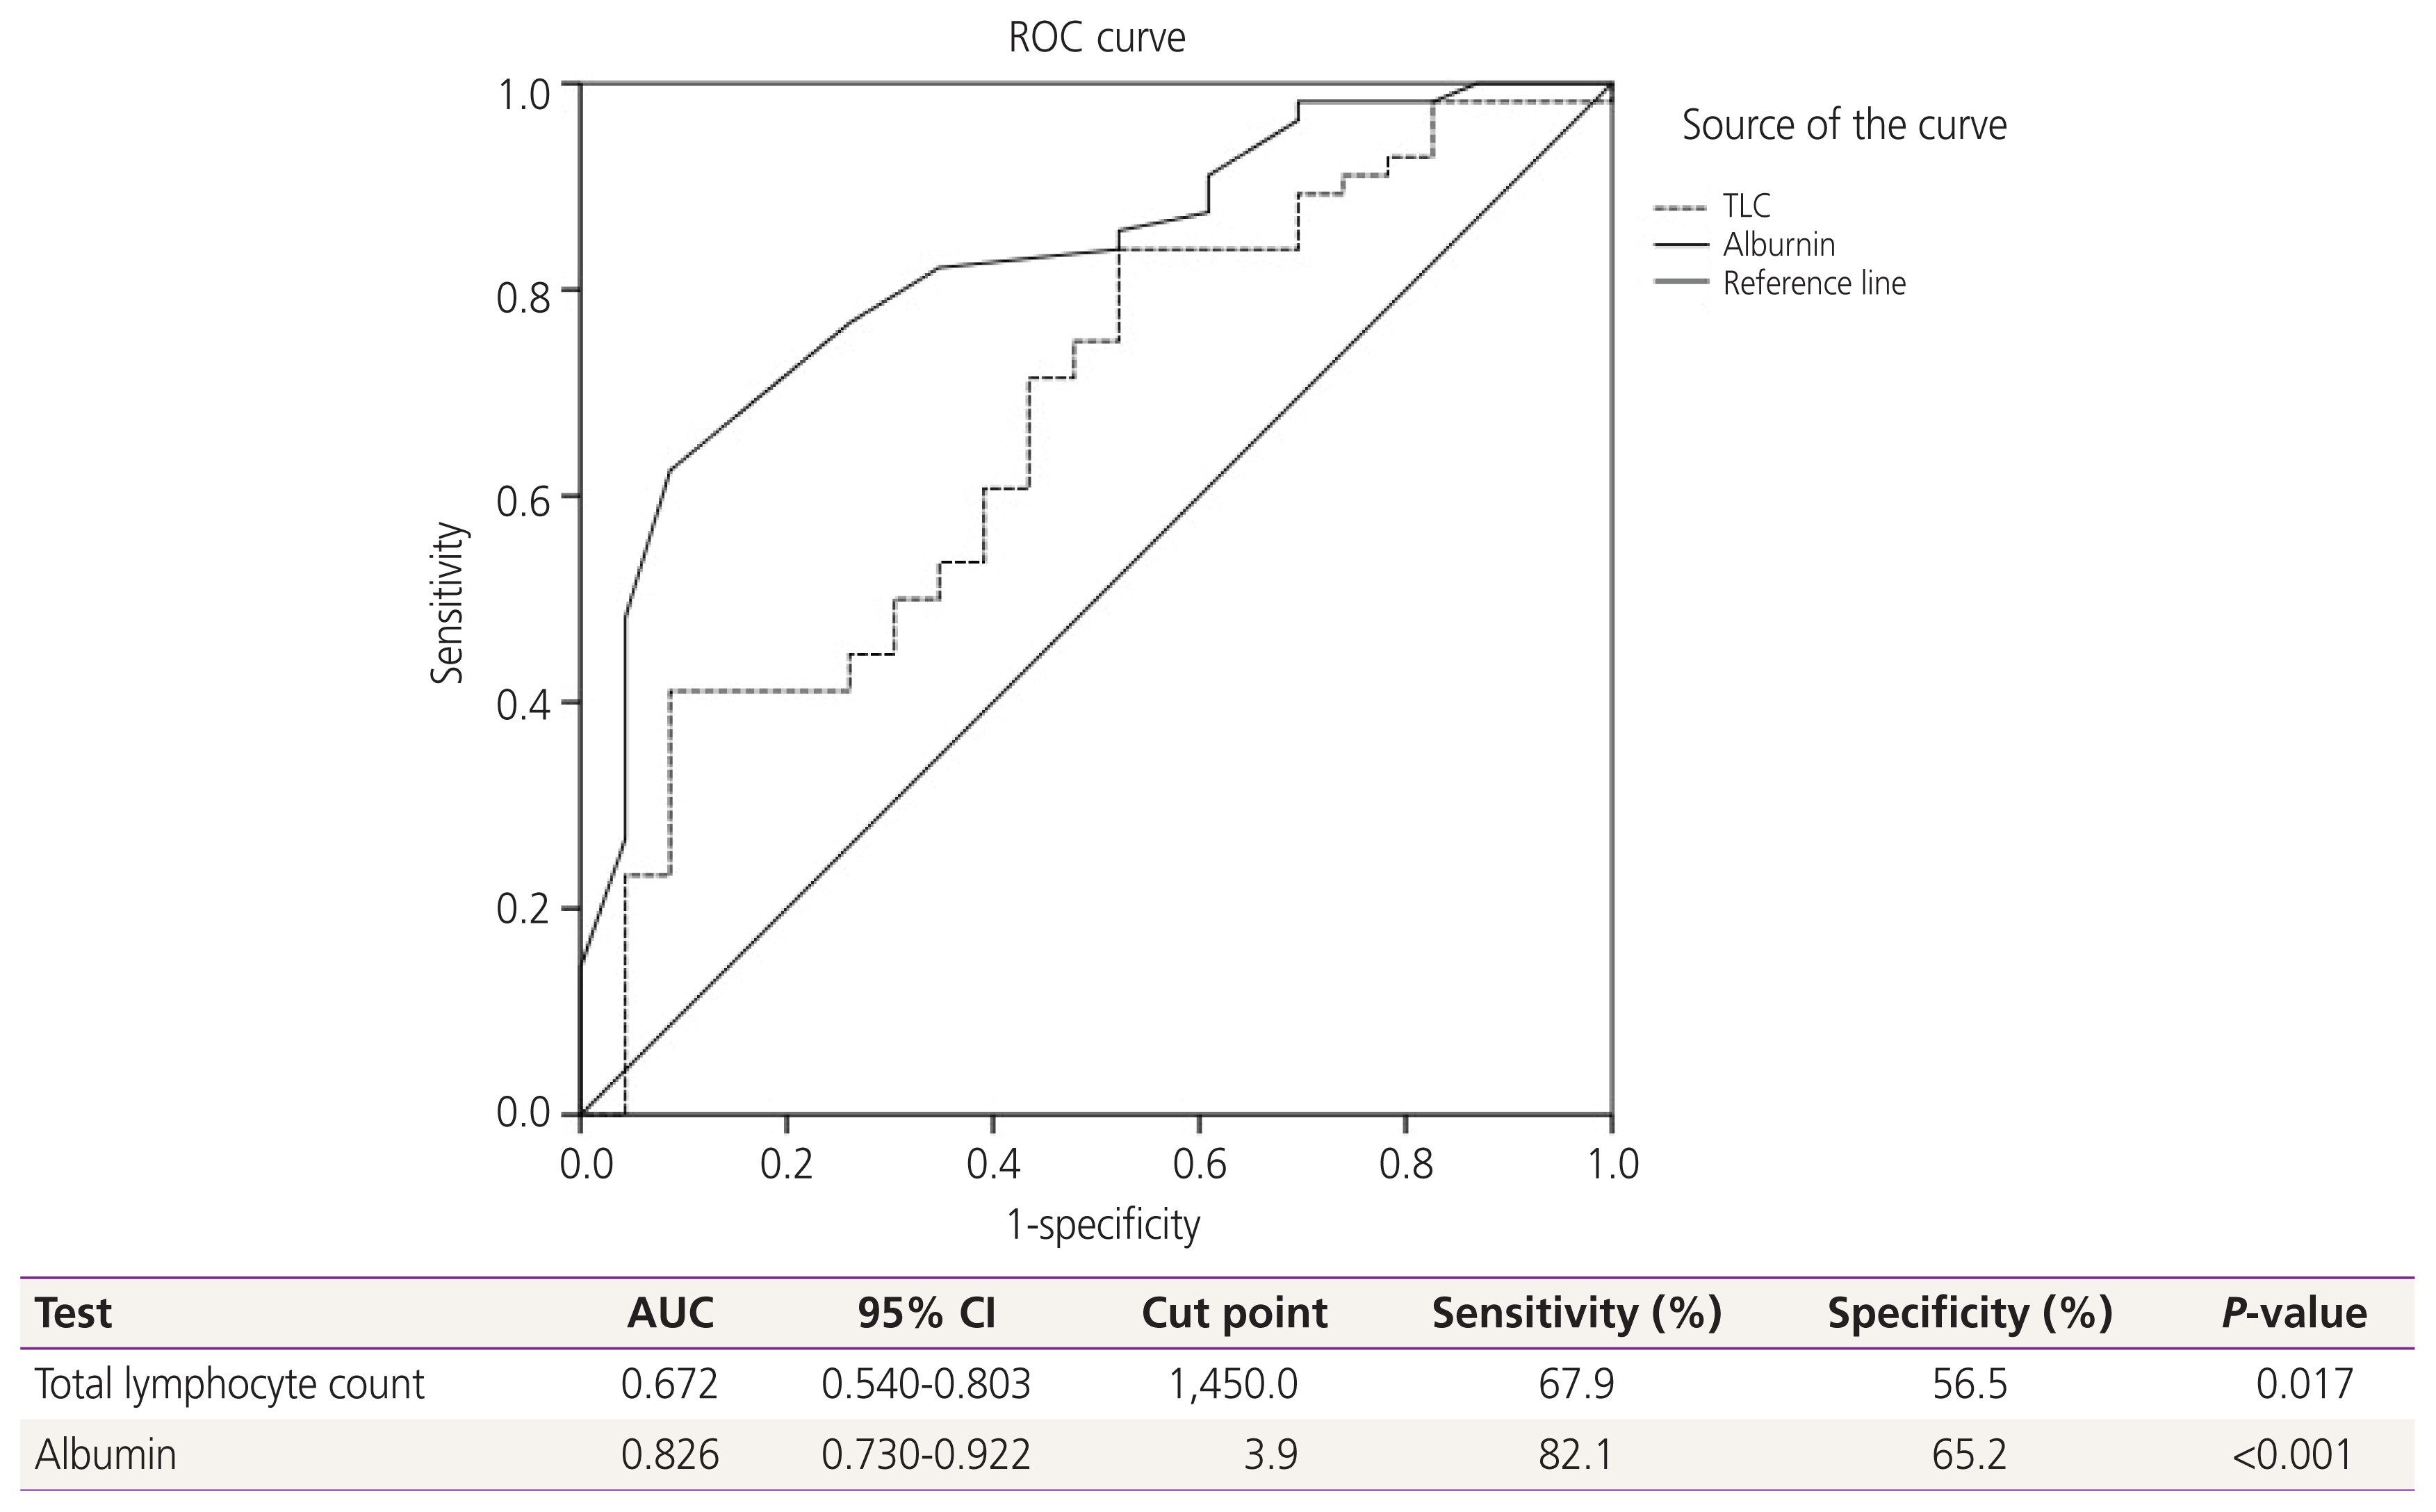
Receiver-operating-characteristics (ROC) and area under the curve (AUC) for relationship of clinicopathologic parameters to malnourishment. A receiver operating characteristic curve (ROC) analysis of the total lymphocyte count (TLC) and albumin level for the prediction of nutritional status revealed a significant area under the curve=0.672 for TLC and 0.826 for albumin level. Therefore, the most effective cut-off point of TLC was 1,450 cells/μL, and for albumin was 3.9 g/dL. Diagonal segments are produced by ties. CI, confidence interval.
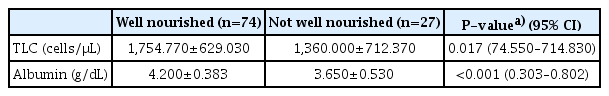
The relationship between total lymphocyte count (TLC) and nutritional status
The possible factors associated with nutritional status were categorized into two groups for comparison in the univariate analysis, and the significant factors were further evaluated in the multivariate analysis (Table 4). The results showed number of cycles of chemotherapy equal to or less than three, an albumin level equal to or less than 3.95 g/dL, a BMI less than or equal to 25 kg/m2, TLC less than 1,450 cells/μL, presence of anemia, and no presence of neutropenia were significant potential associated factors for malnourishment. However, only an albumin level equal to or less than 3.95 g/dL was an independent potential associated factor for malnutrition with an adjusted odds ratio of 6.709 (95% confidence interval 2.113–21.304).

Factors to predict malnourishment status
Discussion
This study found that the prevalence of moderate and severe malnutrition according to the PG-SGA assessment in gynecological cancer patients during treatment with chemotherapy was 18.8% and 7.9%, respectively. This means that about a quarter of these patients were confronted with this problem. This prevalence is closely aligned with cancer-related malnutrition reported in an earlier study that showed the incidence varied from 30% to 90% depending on the tumor site, stage of disease, and treatment [11]. Arielen et al. [7] conducted a cross-sectional study of 60 cancer patients admitted for chemotherapy treatment and evaluated their nutritional status using the PG-SGA. Approximately half of the patients were diagnosed with colon and rectal cancers. They found that the prevalence of malnutrition was 77%. Na et al. [12] reported the nutritional status of 1,588 hospitalized cancer patients using the PG-SGA and found that patients with esophageal, pancreaticobiliary, and lung cancer had significantly higher malnutrition rates than those with stomach, liver, and colon cancer (52.9%, 47.6%, and 42.8% vs. 29.1%, 24.7%, and 15.9%, respectively), and patients undergoing chemoradiation or supportive care had significantly higher malnutrition rates than those undergoing surgery. To the best of our knowledge, there have been no previous cross-sectional studies on the prevalence of nutritional status in gynecological cancer patients during chemotherapy treatment. Laky et al. [13] conducted a prospective study assessing the nutritional status of 145 gynecologic cancer patients before treatment and found that 20% of them were moderately malnourished according to the PG-SGA classification and none were severe. In addition, after adjusting for patient age, BMI, and albumin level, ovarian cancer patients were 19 times more likely to be categorized as malnourished than patients with benign conditions. However, the prevalence of malnutrition in our study was relatively low compared to previous studies [12]. This might be because almost all of our patients had a good performance status and received chemotherapy as first-line treatment, and 40% received only three cycles at the time of the interview.
Chemotherapy toxicities such as nausea, vomiting, constipation, diarrhea, anorexia, malabsorption, taste and olfactory changes, and fatigue encourage changes in ingestion and digestion, leading to malnutrition, which successively increases the chance of poor treatment results by impairing immune functions [3].
With regard to the risk factors for malnutrition, weight loss, high BMI [14], and the prognostic nutritional index, which is calculated by the serum albumin and lymphocyte count, were first mentioned in gastrointestinal surgery cases in cancer patients. Leandro-Merhi et al. [15] studied the relationship between TLC and nutritional status in 131 cancer patients aged >65 years and found that TLC was correlated with mid-upper arm circumference, triceps skinfold thickness, and nutritional risk according to nutritional risk screening. Another study on the biochemical parameters of TLC and albumin was conducted in Brazil by Arielen et al. [7]. They summarized that only an albumin level of less than 3.0 g/dL was significantly associated with the diagnosis of malnourishment according to the PG-SGA. The results of this study were consistent with our findings. We found a significant correlation between the lower mean levels of both TLC and serum albumin in the malnourished group. However, only a serum albumin level of less than or equal to 3.95 g/dL was an independent factor for malnourishment in patients. This is interesting because this albumin level is not the hypoalbumin level defined as less than 3.5 g/dL [16]. Therefore, based on our results, patients who were identified as having these albumin levels should be concerned about their nutritional status. This may be because most of our patients were not seriously ill, and we included both moderate and severe malnutrition in the same group. The possible explanation that TLC did not significantly affect malnutrition in the present study might be the different age groups of the participants when compared to the study by Leandro-Merhi et al. [15].
The strength of the present study was the adequate number of patients who were interviewed by well-trained standardized interviewers, and their blood results came from one institute, which would provide consistent laboratory data. However, our study has two limitations. The first was the heterogeneity of chemotherapy and diagnosis, which could affect the outcome. The second was the cross-sectional design of the study, which meant that we did not know about each patient’s future progress or improvement when they were informed about their nutritional status and the impact of malnutrition on the treatment outcome.
Patients with gynecologic cancer treated with chemotherapy were occasionally found to be malnourished, with the independent predictive predictor being a blood albumin level less than or equal to 3.95 g/dL.
Notes
Conflict of interest
No potential conflict of interest relevant to this article was reported.
Ethical approval
The study was approved by the Chiang Mai University Ethics Committees (Research ID: 07174/OBG-2563-07174, Study Code: OBG-2563-07174/).
Patient consent
All participants provided informed consent.
Funding information
None.