Prognostic value of programmed cell death ligand-1 expression in ovarian cancer: an updated meta-analysis
Article information
Abstract
Objective
To investigate the prognostic significance of programmed cell death ligand-1 (PD-L1) in ovarian cancer.
Methods
PubMed, Embase, and Cochrane Library databases were searched to identify studies that examined the prognostic significance of immunohistochemically assessed PD-L1 expression in histologically confirmed ovarian cancer. Eleven studies on PD-L1 expression involving 1,296 patients with ovarian cancer were included in this meta-analysis. Pooled hazard ratios (HRs) with corresponding 95% confidence intervals (CIs) were analyzed. Relationship between PD-L1 expression, and overall survival (OS) or progression-free survival (PFS) among patients with ovarian cancer was assessed. Subgroup analysis was performed based on the race, histologic type, and tumor International Federation of Gynecology and Obstetrics stage to evaluate the source of heterogeneity. Begg's Funnel plot and Egger's linear test were used to evaluate publication bias. Random-effects model was implemented when significant between-study heterogeneity (I2>50%) was observed.
Results
We found no correlation between PD-L1 expression, and OS (HR, 1.13; 95% CI, 0.95–1.36; I2=78%) or PFS (HR, 1.07; 95% CI, 0.88–1.30; I2=75%) in ovarian cancer. Subgroup analyses showed that higher PD-L1 expression was associated with poor OS in non-Asian patients with ovarian cancer (HR, 1.26; 95% CI, 1.07–1.481; I2=59%). We found that upregulated PD-L1 expression to be a positive predictor for OS in serous ovarian cancer (HR, 0.98; 95% CI, 0.76–1.26; I2=74%) and a negative predictor for OS in non-serous ovarian cancer (HR, 1.29; 95% CI, 1.03–1.61; I2=64%) Furthermore, high PD-L1 expression was found to be a negative predictor for PFS of patients with non-serous ovarian cancer (HR, 1.12; 95% CI, 0.96–1.29; I2=37%).
Conclusion
Our meta-analysis suggests that PD-L1 expression is not associated with patient risk for ovarian cancer.
Introduction
Ovarian cancer is reported as the sixth most common cancer and seventh most leading cause of cancer-associated death among women worldwide [1]. Additionally, ovarian cancer is known to be the second most common gynecological cancer and leading cause of gynecological cancer-related death in the western world [1]. Majority of the patients with ovarian cancer are initially diagnosed at an advanced stage [International Federation of Gynecology and Obstetrics (FIGO) stage III] due to the lack of clinical appearance. Treatment options for these patients continue to be surgery and platinum-based cytotoxic chemotherapy with five-year survival rates of less than 20% [2].
Programmed cell death 1 (PD-1) receptor belongs to the B7-CD28 family of costimulatory receptors. PD-1 is expressed on the surface of T, B, and Natural Killer (NK) cells and has been shown to play key roles in their activation and apoptosis. Programmed cell death ligand-1 (PD-L1) is one of the ligands of PD-1 that is expressed on both tumor and immune cells such as dendritic cells (DCs) or macrophages. Typically, neoantigens produced by tumor cells are recognized by DCs, which further activate cytotoxic T cells. Activated T cells then infiltrate the tumor environment, bind to cancer cells, and release cytokines that trigger apoptosis in target cancer cells. To escape such anti-tumor mechanism, tumor cells have been observed to often overexpress PD-L1 that binds to PD-1 receptors on the activated T cells, thereby inhibiting cytotoxic T cells. Thus, PD-L1 has been known to be part of a crucial immunological escape mechanism, which promotes tumor cell growth, proliferation, and metastasis [34]. However, there are conflicting reports on the relationship between PD-L1 expression and prognosis in ovarian cancer. For instance, Hamanishi et al. [5] reported that PD-L1 expression was associated with poor prognosis in ovarian cancer; however, no relationship between PD-L1 expression and prognosis of ovarian cancer was observed by Mills et al. [6]. Recently, a meta-analysis on PD-L1 expression and prognosis in ovarian cancer has been published in 2018 [7]. This meta-analysis found that PD-L1 expression may be a negative predictor for prognosis of patients with ovarian cancer from Asian countries, while a promising positive predictor for non-Asian patients with ovarian cancer. To gain further clarity on the relationship between PD-L1 expression and ovarian cancer progression, we conducted the present meta-analysis after contemplating high-quality articles that have been recently published.
Materials and methods
1. Literature search
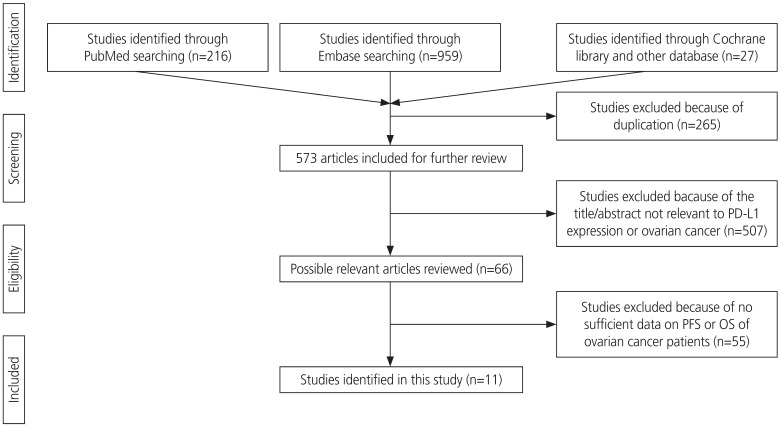
Two authors performed literature search using PubMed, EMBASE, and Cochrane Library databases. Literature search was performed using the following key words: “programmed death ligand 1” or “PD-L1” or “PDL1” or “B7-H1” or “B7H1” or “CD274,” and “ovarian” or “ovary,” and “cancer” or “carcinoma” or “neoplasm” or “tumour.” In addition, a manual search from reference lists of all the eligible studies was conducted to obtain additional references. The final search was conducted on November 7, 2019. Overall, 838 articles were searched using the key words, and 265 articles were excluded due to duplication. Further, 507 articles were excluded because the title and abstract were not relevant to PD-L1 expression and ovarian cancer. Additionally, 55 articles were excluded as sufficient data on overall survival (OS) or progression-free survival (PFS) rate were not available. Finally, 11 articles were included in this meta-analysis. Ethical approval or patient consent was not required for our meta-analysis as only previously published studies were analyzed.
2. Eligibility criteria
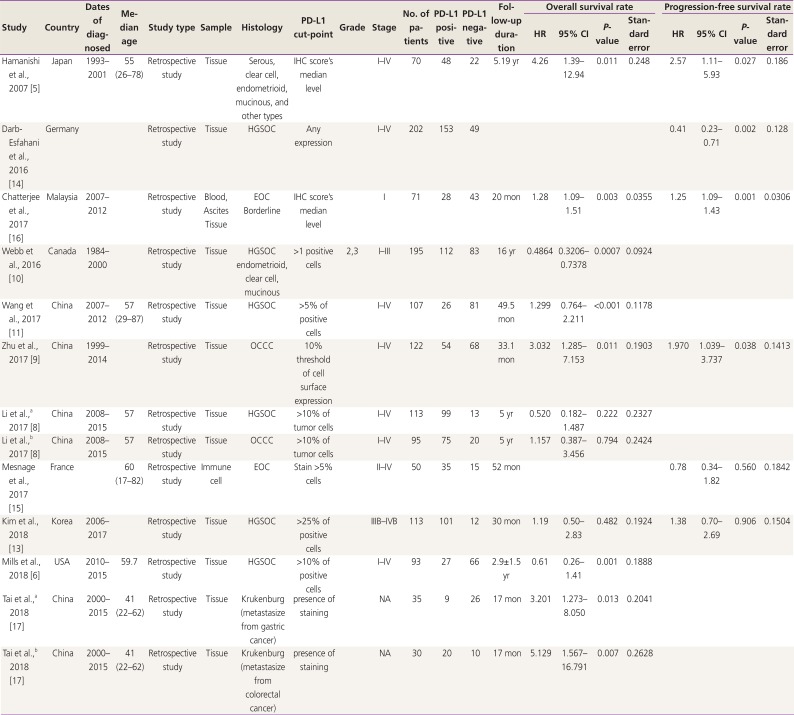
The inclusion criteria for the studies in our meta-analysis were as follows: studies focusing on ovarian cancer, involving patients with histologically confirmed ovarian cancer, studies on PD-L1 (B7-H1) expression that was detected by immunohistochemistry (IHC) staining of tumor tissue, and studies investigating potential association between PD-L1 expression and OS or PFS of patients with ovarian cancer. IHC scoring system for PD-L1 was developed based on percentage of positive tumor cells and staining intensity. Staining intensity was graded as 0 (no staining), 1 (weak), 2 (intermediate), or 3 (strong), whereas distribution of the cellular staining was graded as 0 (none), 1 (<10% of cells), 2 (11–50% of cells), 3 (51–75% of cells), or 4(>75% of cells). Scores 0 and 1 were defined as low expression, and scores 2 and 3 were defined as high expression [5678], and the PD-L1 cut-off point was different in each article (Table 1). All articles included in this meta-analysis were written in English.
3. Data extraction
Two authors, Maria Lee and Jinlan Piao, independently extracted the following information from every study included in our meta-analysis: name of the first author, publication year, country, median age, study type, source of resected tumor histology, FIGO stage and grade, number of patients, number of PD-L1-positive and negative patients, hazard ratios (HRs) with corresponding 95% confidence intervals (CIs), OS, and PFS. The end point for PFS was defined as the day of recurrence, while that for OS was defined as the day when the patient was confirmed alive or dead, respectively [9].
4. Assessment of study quality
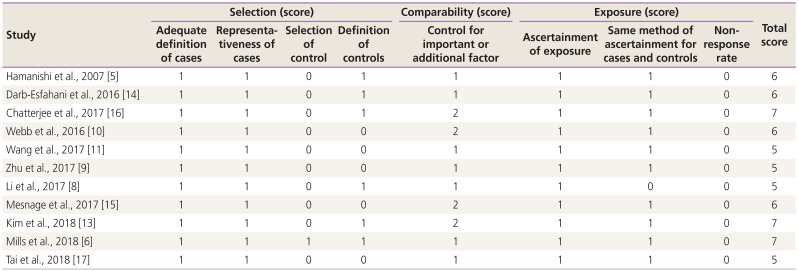
Two authors independently assessed the quality of the included studies using Newcastle-Ottawa Quality Assessment Scale (NOS). Disagreements in scoring were resolved by discussing with a third reviewer. NOS was used to evaluate the following three parameters: selection (0–4 points), comparability (0–2 points), and outcome (0–3 points). The highest NOS score was 9 points, and studies scoring greater than 5 were classified as high-quality.
5. Statistical methods
Pooled HRs with corresponding 95% CIs were used to evaluate the association between PD-L1 expression and prognosis of patients with ovarian cancer. Subgroup analysis was performed based on the race, histologic type of ovarian cancer, and tumor FIGO stage of the enrolled patients with ovarian cancer. Random-effects model was implemented when significant heterogeneity (I2>50% or P<0.1) was detected between the studies. Potential publication bias was visually assessed by Begg's funnel plot and Egger's linear test. This meta-analysis was performed using Review Manager 5.3 and STATA 15. P<0.05 was considered to be statistically significant.
Results
1. Search results
A total of 838 articles were screened for this study. After exempting duplicates, the title and abstract were screened for relevance. Articles that were not directly related to the subject of our meta-analysis or that did not provide a potential relationship between PD-L1 expression data and OS or PFS of patients with ovarian cancer were excluded. Finally, 11 articles (13 comparisons) published between 2006 and 2018 with NOS ≥5 were included in our meta-analysis. The screening process is described in Fig. 1.
2. Study characteristics
Characteristics of the included studies are shown in Table 1. In our meta-analysis, 11 studies (13 comparisons) were included, which involved 1,296 patients with ovarian cancer that were examined for PD-L1 expression and prognosis. The included studies were typically high-quality with NOS ≥5 (Table 2). In all the selected studies, PD-L1 expression levels were detected by IHC staining. The included studies were observed to have 7 patient cohorts with high-grade serous ovarian cancer (HGSOC) [81011121314], 4 cohorts with ovarian clear cell carcinoma (OCCC) [589], 2 cohorts with endometrioid ovarian cancer [510], 2 cohorts with mucinous ovarian cancer [510], 2 cohorts with epithelial ovarian cancer (EOC) [1516], 1 cohort with borderline ovarian cancer [16], and 2 cohorts with krukenburg tumor of ovarian cancer [17]. Among the 1,296 patients included in these 11 studies, 640 patients were found to be diagnosed with early stage (FIGO stage I–II) ovarian cancer and 519 patients with advanced stage (FIGO stage III–IV) ovarian cancer (Table 1).
3. Association between PD-L1 expression and OS or PFS in ovarian cancer
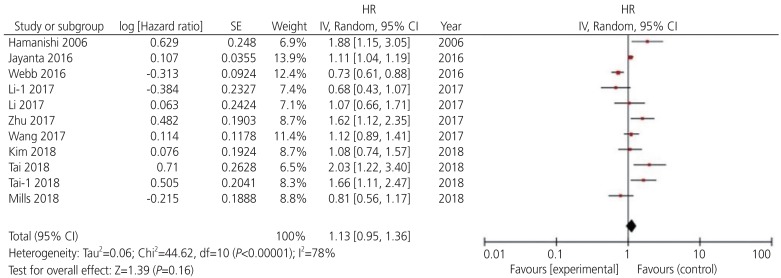
Among the 13 potential comparisons, 11 assessments were observed to analyze the relationship between PD-L1 expression and OS of patients with ovarian cancer. The data were pooled using random-effects model due to significant heterogeneity between the studies (I2=78%, P<0.0001). Based on the pooled HR, we found that increase in PD-L1 expression was not significantly associated with OS of patients with ovarian cancer (HR, 1.13; 95% CI, 0.96–1.36; P<0.001; I2=78%) (Figs. 2 and 3). Among the 11 included studies, 6 evaluated PD-L1 expression and PFS of patients with ovarian cancer. The data were pooled using random-effects model due to significant heterogeneity between the studies (I2=78%; P<0.001). Our results indicated that increase in PD-L1 expression was not significantly associated with PFS of patients with ovarian cancer (HR, 1.07; 95% CI, 0.88–1.30; I2=75%; P=0.51) (Fig. 4).

Forest plot for overall survival rate of patients with ovarian cancer.
HR, hazard ratio; SE, standard error; IV, inverse variance random; 95% CI, 95% confidence interval.

Begg's funnel plot (P=0.029) and Egger's linear regression test (P=0.180) for assessing potential publication bias while establishing the potential relationship between programmed cell death ligand-1 expression and overall survival rate in patients with ovarian cancer.
SE, standard error; HR, hazard ratio; SND, standard normal deviate; 95% CI, 95% confidence interval.

Forest plot for determining progression-free survival rate of patients with ovarian cancer.
HR, hazard ratio; SE, standard error; IV, inverse variance random; 95% CI, 95% confidence interval.
Subgroup analyses showed that higher PD-L1 expression was associated with poor OS of non-Asian patients with ovarian cancer (HR, 1.26; 95% CI, 1.07–1.481; I2=59%); however, a similar trend was not observed in Asian patients. Upregulated PD-L1 expression was found to be a positive predictor for OS in serous ovarian cancer (HR, 0.98; 95% CI, 0.76–1.26; I2=74%) and a negative predictor for OS in non-serous ovarian cancer (HR, 1.29; 95% CI, 1.03–1.61; I2=64%). In contrast, higher expression of PD-L1 was observed to be a negative predictor for early stage (HR, 1.20; 95% CI, 0.86–1.68; I2=90%) and advanced stage ovarian cancer (HR, 1.09; 95% CI, 0.90–1.33; I2=54%). Additionally, we found that PD-L1 expression was a negative predictor for PFS of patients with serous (HR, 1.04; 95% CI, 0.65–1.67; I2=86%) and non-serous ovarian cancer (HR, 1.12; 95% CI, 0.96–1.29; I2=37%) (Tables 3 and 4).

Subgroup analysis for programmed cell death ligand-1 expression and the outcome of overall survival rate of patients with ovarian cancer
4. Publication bias
Funnel plots were used to assess the studies included in our meta-analysis for potential publication bias. As shown in Figs. 3 and 5, funnel plots revealed asymmetry for OS (Begg's funnel plot, P=0.029) but did not show asymmetry for the PFS (Begg's funnel plot, P=0.612) of patients with ovarian cancer. Egger's linear tests were used to identify publication bias in OS (Egger's test, P=0.180).
Discussion
PD-1 is a member of the CD28 costimulatory receptor superfamily. PD-1 transmits inhibitory signals that abrogate T cell receptor-mediated activating signals, thereby preventing further antigen-mediated activation of T-cells. One of its ligands, known as PD-L1 or CD274, is mainly expressed on the surface of tumor cells and antigen-presenting cells in many solid malignancies [1819]. In addition to tumor cells, high expression levels of PD-L1 have been observed in human tumor-associated antigen-presenting cells, which includes tumor environment-associated DCs, tumor-draining lymph node DCs, macrophages, fibroblasts, and T cells [192021]. PD-L1 is an important immune regulatory factor, and as a receptor for PD-1, it plays a key role in the immune escape mechanism of cancer cells. PD-L1 specifically binds to the PD-1 receptor of T cells and impairs the activation and differentiation of T cells. Tumor-infiltrating immune cells have been shown to induce cytokines such as interferons and vascular endothelial growth factors that upregulate PD-L1 expression [22232425]. PD-L1 upregulation is known to regulate various intracellular signaling pathways both at the transcriptional and translational levels. Additionally, this upregulation has been reported to alter the production of various pre-inflammatory factors and cytokines that are secreted in the tumor microenvironment [2627]. Therefore, PD-L1 overexpression may potentially influence cancer progression and be associated with poor prognoses. Studies on the expression, regulation, and function of the PD pathway in human cancer microenvironment have provided scientific rationales that have directly supported the current clinical application for blocking the PD pathway [1820]. Moreover, PD-L1 is known to be expressed and associated with the prognosis of many human cancers such as lung [28], breast [29], hepatocellular [30], cervical [31], and ovarian cancers [82332].
Since PD-1/PD-L1 pathway is suggested to play a pivotal role in the immune escape mechanism and growth of cancer cells [433], the relationship between PD-L1 expression and prognosis of ovarian cancer has markedly attracted several researchers and clinicians. Previous reports [343536] have suggested the crucial role of PD-1/PD-L1 inhibition in ovarian cancer treatment. Furthermore, some studies have proposed that PD-L1 may not only be a good therapeutic target but also a prognostic biomarker for ovarian cancer [5910111517]. However, other studies have yielded discrepant results. Thus, the issue still remains controversial concerning ovarian cancer. A previous meta-analysis that investigated the association between PD-L1 expression and prognosis of ovarian carcinoma found that PD-L1 expression is a poor-prognosis biomarker in Asian populations; however, it is a good-prognosis biomarker in non-Asian patients with ovarian cancer [7].
In this meta-analysis, we included 11 studies (13 comparisons). From the selected studies, 11 comparisons were found analyzing the relationship between PD-L1 expression and OS of patients with ovarian cancer, while 6 comparisons were found analyzing the relationship between PD-L1 expression and PFS in ovarian cancer. Overall, our meta-analysis showed that PD-L1 expression was not associated with OS or PFS of patients with ovarian cancer. As high heterogeneity was observed among the included studies, we performed subgroup analysis to investigate the source of heterogeneity. We found that in Asian patients, PD-L1 expression was not associated with OS in ovarian cancer (HR, 0.77; 95% CI, 0.66–0.89; P=0.59; I2=0%). However, in non-Asian patients with ovarian cancer, high PD-L1 expression was observed to increase the risk of OS (HR, 1.26; 95% CI, 1.07–1.48; P=0.01; I2=59%). Intriguingly, our data differed from the conclusions of the previous meta-analysis published in 2018 [7]. Furthermore, our meta-analysis revealed that PD-L1 expression was associated with histology, tumor stage in OS of patients with ovarian cancer. In clinical studies, PD-L1 expression in cancer was mostly studied at the protein level using IHC. However, there are limitations in PD-L1 IHC standardization that may end up with discordant results. While reviewing the included articles, we found that the PD-L1 cut-off point was different in each study. Thus, it is possible that the variations in the cut-off value and antibodies of PD-L1 might have caused the heterogeneity. Moreover, the previous studies revealed that patients with IHC-positive tumors may not respond to treatment [37].
Our meta-analysis had certain limitations. For example, at the literature review level, we cannot exclude the possibility that despite our best efforts, some relevant studies may have been inadvertently excluded or not found in our queried databases using the selected search terms. Moreover, only studies published in English language journals were included in our meta-analysis, which introduces a selection bias. We are aware of the fact that although our qualitative assessment of the primary studies would have revealed certain inherent biases, it would have not encapsulated the aggregate effect of any potential biases from the pooled HRs.
In summary, our updated meta-analysis suggests that PD-L1 expression is not associated with OS or PFS of patients with ovarian cancer. Due to high heterogeneity, the data are not highly reliable. Furthermore, PD-L1 expression was observed to be associated with histological type or FIGO stage of ovarian cancer, specifically with non-Asian patients with this disease. Thus, additional research with prospective large-cohort studies involving diverse population should be conducted to conclusively demonstrate whether PD-L1 expression has a significant prognostic value in ovarian cancer.
Acknowledgements
This work was supported by a grant from the Seoul National University Hospital Research Fund (Grant No. 03–2019-0260).
Notes
Conflict of interest: No potential conflict of interest relevant to this article was reported.
Ethical approval: Ethical approval was not required for our meta-analysis as only previously published studies were analyzed.


