


Introduction
Over 60% of middle-aged Korean women have lower urinary tract symptoms (LUTS) [1]. Whilst they are not life-threatening, LUTS can affect quality of life, so it is important to investigate LUTS in detail [1]. Lower urinary tract dysfunction (LUTD) is associated with symptoms such as urinary incontinence, urgency, frequency, nocturia, voiding dysfunction, and so on [2]. Patients with these symptoms often have diagnosed diseases such as stress incontinence, detrusor overactivity (DO), hypoactive bladder, intrinsic sphincter deficiency (ISD), and reduced bladder compliance. Clinical diagnosis of LUTD, including overactive bladder (OAB), is usually based on existing symptoms [3]. The International Continence Society (ICS) defines OAB as a symptom complex associated with urinary urgency with or without urinary incontinence, and is generally related to frequency and/or nocturia [4].
It is important to diagnose these diseases early and implement treatment and management strategies promptly. Urodynamics is a series of tests that can diagnose lower urinary tract function problems by assessing a patient's bladder filling, urine storage, and bladder emptying functions [5]. Cystometry is also used to measure LUTD, but it is expensive, invasive, and technically difficult. Despite aseptic techniques, an urodynamic study (UDS) carries high risk of infections such as bacteriuria and bacteremia due to invasive cystometry [6]. On the other hand, ultrasonography is widely used as a measurement tool to evaluate the morphology and dynamic anatomy of the lower urinary tract in women, and is a relatively inexpensive and simple diagnostic method.
Recently, attempts have been made to differentiate urinary symptoms by measuring bladder wall thickness (BWT) using ultrasonography [3,7,8,9,10,11]. Some previous studies have shown that BWT increases correlate with DO, but some studies have reported the opposite finding [7,9]. Blatt et al. [9] reported that OAB diagnosis should not be based solely on mean BWT without consideration of UDS findings. Meanwhile, Güzel et al. [7] reported that measurement of BWT can be used for detecting bladder outlet obstructions.
Several studies describing the correlation between female LUTS and BWT have been published, and detrusor muscle hypertrophy is known to be associated with a number of LUTS disorders [12]. For men, BWT measurements are already used to distinguish between bladder outlet obstruction and DO, but the correlation is not yet clear for women [12]. To obtain more accurate conclusions and credible results, we evaluated the correlation between BWT and LUTS, as well as the UDS parameters associated with LUTS.
In this study, we aimed to investigate whether BWT measurements could be used as possible tools for more accurate and convenient diagnosis of LUTS.
Materials and methods
Forty-eight women with LUTS who underwent UDS and BWT by ultrasonography as outpatients were studied. First of all, we assessed frequency, nocturia, urgency, and urge incontinence and confirmed the presence or absence of each symptom during a medical examination by interview.
According to the ICS diagnostic criteria, the following symptoms were defined and diagnosed [2]: 1) increased daytime frequency, manifesting as too frequent urination causing discomfort to the patient, 2) nocturia, which is the need for urination at night causing the patient to wake-up more than once, and 3) sudden urgency to urinate and urinary incontinence, leading to involuntary leakage of urine. We also noted the DO duration, and the average urination frequency, nocturia, and incontinence episodes via a 3-day urination log.
Additionally, body mass index (BMI), number of deliveries, and presence or absence of pelvic organ prolapse were also investigated. We excluded patients who had visited another hospital previously because we did not know what treatment they had received, including medications, behavioral therapy, or other treatments. Urinary analysis was performed to exclude LUTS caused by urinary tract infection.
We also attempted to measure the detrusor wall thickness (DWT) by ultrasonography to diagnose LUTD more easily. However, since it is difficult to accurately measure DWT using ultrasonography [13], we assumed that the DWT was also thick if the BWT was thick; thus, we measured the BWT and replace it.
The thinnest part of the bladder wall was measured by a transabdominal ultrasonography machine, either SSD-5000/Alpha 7 (Aloka, Tokyo, Japan) or Accuvix XQ/Accuvix V10 (Medison, Seoul, Korea) with 3-5 MHz.
If residual urine in patients' bladder was 200 mL as assessed by ultrasonography, the BWT was also measured by ultrasonography. According to Blatt et al. [9] and Üçer et al. [10], BWT was measured at 200 mL and 250-300 mL filled bladder volume, respectively. According to Oelke et al. [14], DWT has no significant changes in bladder volume above 250 mL. Thus, we measured the BWT after filling the bladder with 200 mL of normal saline solution.
The BWT was defined as the thinnest layer at the anterior part of the bladder opposite to the internal urethral meatus and within 2 cm of the midsagittal plane [15]. The Qmax, the Valsalva leak point pressure (VLPP), the maximal urethral closure pressure (MUCP), the functional length, the postvoid residual volume (PVR), and the volume voided per micturition were measured via UDS using SOLAR software 8 (MMS, Williston, VT, USA). In addition to measuring the thickness of the symptomatic person, a diagnosis was made based on the UDS findings. Following that, we divided patients with stress incontinence, DO, hypoactive bladder, ISD, and reduced bladder compliance, and according to their BWT (<3 mm or ≥3 mm).
We constructed receiver operating characteristic (ROC) curves for diagnosis of OAB according to the symptoms. We also determined reliable BWT criteria by calculating the area under the curve (AUC).
Statistical analyses were performed using IBM SPSS Statistics Version 20 (Statistical Package for Social Science, Inc., Tokyo, Japan) and the normality of data was tested using the Kolmogorov-Smirnov method. Student's t-test was used to evaluate statistically significant differences between the mean values of BWT for different urodynamic diagnoses, and ROC curves were used to determine the diagnostic value of BWT measurements.
This study was approved by the Institutional Review Board of Seoul Asan Medical Center (2017-0958).
Results
Table 1 shows the baseline characteristics of the patients under investigation. The average age of the 48 patients included in this study was 59.9±9.7 years (range, 38-77), mean BMI was 26.0±3.4 kg/m2 (19.3-34.1), and mean parity was 2.5±1.3 (0-7). Among the 48 patients with symptoms of DO, 41 (85.4%), 39 (81.3%), 39 (81.3%), and 34 (70.8%) also experienced frequency, nocturia, urgency, and urge incontinence, respectively. The mean duration of DO was 53.4±48.4 months (range, 2-120). The mean number of micturitions per 24-hours was 12.3±5.6 (range, 5.5-30.5), and the volume voided per micturition was 248.6±54.4 mL (range, 29-336). There were 17 patients (35.4%) with pelvic organ prolapse.
Table 1
Baseline characteristics
Table 2 shows the correlation between the UDS parameters and the BWT in 2 groups: patients with BWT <3 mm (n=25) and those with BWT ≥3 mm (n=23), based on the values obtained by dividing BWT by the 50th percentile of total patient data. The VLPP (p=0.064), MUCP (P=0.319), functional length (P=0.538), and PVR (P=0.488) measurements in the BWT ≥3 mm group were higher than those in the BWT <3 mm group; however, the differences were not statistically significant (P>0.05). On the other hand, Qmax (25.24 vs. 23.91 mL/s, P=0.187) and the duration of symptoms (62.3 vs. 43.7 months, P=0.009) were significantly lower in the BWT ≥3 mm group.
Table 2
The correlation between bladder wall thickness (BWT) and parameters of urodynamic diagnosis
Values are expressed as mean±standard deviation.
UDS, urodynamic study; VLPP, Valsalva leak point pressure; MUCP, maximal urethral closure pressure; PVR, postvoid residual volume.
Based on our division of patients into 2 groups according to BWT, the number of UDS diagnoses for each condition are shown in Table 3. In patients diagnosed with hypoactive bladder, 6 (26.1%) had a BWT ≥3 mm and 3 (12%) had a BWT <3 mm (P=0.009). All 5 patients diagnosed with ISD had a BWT ≥3 mm (P=0.001). These differences were statistically significant with a P-value <0.05.
Table 3
Bladder wall thickness (BWT) grouped by urodynamic diagnosis
Values are expressed as number of patients (%).
UDS, urodynamic study; DO, detrusor overactivity; ISD, intrinsic sphincter deficiency.
Fig. 1 shows the ROC curve of the relationship between specificity and sensitivity for patients with DO symptoms. The AUC, standard deviation, P-value, and confidence intervals for BWT cut-off values of 3 mm and 5 mm are shown in Table 4. According to the ROC curves, the AUC was 0.791 (P=0.035) and 0.665 (P=0.231) for BWT cut-off values of 3 and 5 mm, respectively, in symptomatically diagnosed OAB patients.
Fig. 1
Receiver operating characteristic (ROC) curve of the relationship between specificity and sensitivity for symptomatically diagnosed overactive bladder (OAB) patients according to bladder wall thickness (BWT).
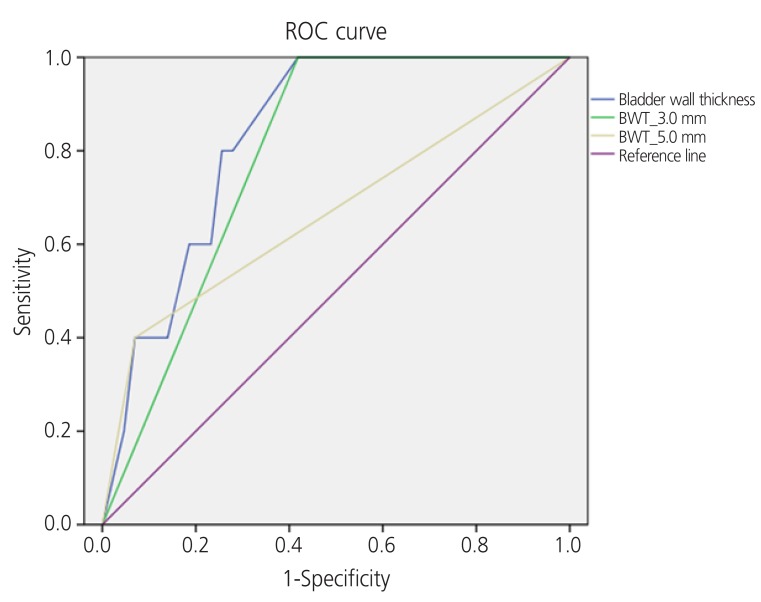
Table 4
Statistical results of receiver operating characteristic curve according to bladder wall thickness in the diagnosis of overactive bladder
BWT, bladder wall thickness; AUC, area under the curve; SD, standard deviation.
a)Non-parametric assumption; b)Null hypothesis.
| BWT | AUC | SDa) | P-valueb) | 95% confidence interval | |
|---|---|---|---|---|---|
| Lower limit | Upper limit | ||||
| BWT | 0.833 | 0.070 | 0.016 | 0.696 | 0.969 |
| BWT_3.0 | 0.791 | 0.074 | 0.035 | 0.647 | 0.935 |
| BWT_5.0 | 0.665 | 0.149 | 0.231 | 0.374 | 0.956 |
Discussion
In our study, the mean BMI of our patients with a mean age of 59.96 years was 26.06±3.40, which is relatively high compared to the average BMI of 24 kg/m2 for women in their 50s and 60s.
Because BMI can affect BWT, we divided the patients into subgroups based on BMI of 25, which is the standard for obesity and examined its correlation with BWT. Patients with BMI ≥25 had a mean BWT of 2.73±1.45 and those with a BMI <25 had a mean BWT of 3.1±1.35. Although the mean BMI of patients was high, the P-value was not significant (0.41), which is unlikely to have a significant impact on our results (Table 5).
Table 5
Bladder wall thickness grouped by body mass index and parity
| Characteristics | No. of patients | BWT (mm, mean±SD) | P-value | |
|---|---|---|---|---|
| BMI (kg/m2) | ||||
| <25 | 21 | 2.73±1.45 | NS | |
| ≥25 | 27 | 3.1±1.35 | NS | |
| Parity | ||||
| 0 | 3 | 2.27±0.64 | ||
| ≥1 | 45 | 2.82±1.35 | ||
The correlation between parity and BWT was also examined. Mean BWT was 2.27±0.64 for women with no experience of labor, which was lower than the mean BWT of our patients. BWT of the women who gave birth was not related to the number of deliveries; thus, subgroups were classified into 0 and 1 delivery or more. However, based on this classification, there were only 3 patients with no experience of labor and hence, we could not analyze the data statistically.
In addition, only the presence or absence of prolapse symptoms was investigated in patients. Because the main symptom was not due to prolapse, during outpatient visit for LUTS, it was considered a mild stage that did not require treatment. Thus, we believe that the degree of prolapse would not have a significant impact on the parameter of this study.
Many previous studies have reported that DO leads to an increase in DWT due to histopathological changes such as hyperplasia and hypertrophy in the bladder smooth muscle [7,16,17]. Oelke et al. [14] reported the main reason for the increase in BWT is hypertrophy of the muscle layer and the other 2 layers undergo pathological changes due to other causes, such as inflammation or cancer. The DWT represents the thickness of the iso- or hypoechogenic layer at the bladder dome opposite the internal urethral meatus within 2 cm of the midsagittal plane [15], and the BWT shows 3 histological layers on ultrasound: an outer hyperechoic subserosal layer, a middle hypoechoic muscle layer, and an inner hyperechoic mucosal layer [18]. Thus, to examine the correlation between LUTD and wall thickness, DWT should be measured [13]. However, since DWT measurements were difficult, we replaced DWT with BWT in this study to investigate the relationship between DWT and LUTS and we set the BWT cut-off value as 3 mm because the BWT range reported in other studies was around 3-6 mm [12,19,20] and the approximate median value of BWT for our patients was 3 mm.
One of the reasons for an increase in BWT is the neurogenic bladder [21]. The neurogenic bladder is a dysfunction of the bladder caused either by the part of central nervous system that is involved in urinary control, or by peripheral nerve disease. The hypoactive bladder is the result of the underactivity of the detrusor muscle, decreasing contraction strength and/or prolongation of bladder emptying which may often be incomplete [22]. The hypoactive bladder is a type of neurogenic bladder often observed in neurologic conditions and myogenic failure, and is likely to increase BWT. In our study, hypoactive bladder was more frequent in patients with BWT ≥3 mm. In this group, the number of patients diagnosed with hypoactive bladder was 6; meanwhile, only 3 patients in the group with BWT <3 mm were diagnosed with hypoactive bladder.
ISD was more frequent in patients with BWT ≥3 mm in the present study. The internal sphincter muscle is a muscle that wraps around the urethra at the bladder neck, which is relaxed by the autonomic nerve during voiding. ISD leads to weakening of these muscles, and urine leaks out before the bladder reaches maximum filling; thus, the maximum volume of the bladder must be reduced. One study showed that increases in BWT are related to reduced bladder capacity [23]. In this context, ISD may also be a cause of increases in BWT. However, further investigations are needed to elucidate the precise mechanism behind the influence of ISD on BWT.
In addition, stress incontinence (52.5%) was the most common diagnosis in patients with BWT ≥3 mm. However, we decided to not divide patients with stress incontinence according to BWT because 80% of patients with a BWT <3 mm were diagnosed with urodynamic stress incontinence.
In the present study, we found a significant correlation between BWT and the UDS diagnosis (Table 3). In previous studies, there have been reports that BWT is associated with LUTD, such as OAB or bladder outlet obstruction, too. However, there are no studies describing this association with objective diagnosis via UDS in women with LUTS [7,10].
On the other hand, in the case of DO and reduced bladder compliance, there was a significant correlation, but it was difficult to determine the correlation between BWT and each diagnosis because of the small number of patients (only 0-2).
To obtain the diagnostically significant BWT cut-off value in patients with LUTs, we attempted to construct a ROC curve; however, the number of patients for each diagnosis was too small. Therefore, we diagnosed patients with OAB using a questionnaire. Patients with DO symptoms (frequency, nocturia, urgency or urge incontinence) were diagnosed with OAB and we constructed a ROC curve based on that data. The results are shown in Fig. 1. When the BWT cut-off value was 3 mm, the AUC was 0.796 (P=0.035), and because this value was more than 0.7, it was considered a reliable cut-off value. However, when the BWT cut-off value was 5 mm, the AUC was 0.665 (less than 0.7) (P=0.231), which is considered unreliable. Thus, BWT of <3 mm was shown to be a significant cut-off value when used in conjunction with an OAB diagnosis based on symptoms. A diagnosis of OAB could be predicted using BWT measurement.
In conclusion, hypoactive bladder and ISD were significantly higher in patients with BWT ≥3 mm. In symptomatically diagnosed patients with OAB, there was a significant correlation when the BWT cut-off value was 3 mm. However, the UDS parameters and BWT were not directly related.
This study examined whether BWT could be used to detect LUTD, and confirmed that this was true for certain diagnoses but not for others. However, because the total number of patients was low, the ROC curve analysis for patients diagnosed via UDS was not possible, which made it challenging to establish a more accurate cut-off value for each diagnosis. The number of patients enrolled in this study was small; thus, the lower accuracy and lack of universal applicability of the results are a few limitations. Moreover, the BWT was measured only in the anterior wall, there is a need to consider the deviation of BWT values depending on the location. Also, further studies are needed to determine differences in the BWT values according to the degree of filling of the bladder. Therefore, we conclude that BWT may be used for predicting LUTD, but further studies are needed before it can be used more widely as a diagnostic parameter.


")